Question-and-Answer Resource for the Building Energy Modeling Community
Get started with the Help page
Ask Your Question
1

Openstudio's Electrical Consumption, Heating and Cooling Graphs, Monthly Values

asked 2021-04-20 20:58:33 -0500

Leon1das's avatar

updated 2021-04-22 11:27:44 -0500

Hello, I was wondering if anyone would know how to generate the charts that follow in the Openstudio's results as shown below:

image description

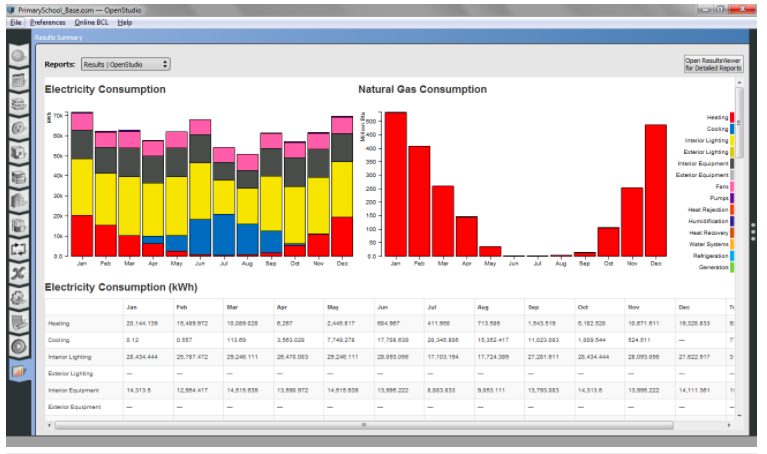
I have been able to generate some data however it only comes in the form of discrete values such as site and source energy (generated as energy plus Results) as opposed to showing the monthly fluctuating electrical consumption and so forth. Additionally is it possible to generate monthly graphs such as these outlining the heating and cooling loads experienced?

Any help would be greatly appreciated.

edit retag flag offensive close merge delete

Comments

You can report the output variables of interest and view them through the data viewer (DView) which displays time series results in graphical format. In your case you can click on the Results Viewer (top right corner in the image you attached) and view detailed results. For something as simple as generating monthly bar charts, why don't you just copy the data of interest to excel and generate your own figures/charts?

Ammar De's avatar Ammar De  ( 2021-04-22 18:30:05 -0500 )edit

Ah I understand what you are saying thank you. Yes it would be possible to import the data into excel I was just hoping to understand why the software fails to graphically interpret the data. In the reports drop down bar on the top left it only has the option of "EnergyPlus Results" I was hoping to possibly view the "OpenStudios Results" but am unable to understand how I can generate them.

In the top right corner as you described it states on my computer "Set Path to DView in Preferences" have you come across this or perhaps know how to fix this? Any further help would be appreciated.

Leon1das's avatar Leon1das  ( 2021-04-25 23:02:09 -0500 )edit

1 Answer

Sort by ยป oldest newest most voted
2

answered 2021-04-26 20:07:15 -0500

Ammar De's avatar

You need to add a specific reporting measure in order to view the Openstudio results. You can download the measure from OpenStudio Application by going to Components & Measures > Find Measures > then search for "OpenStudio Results" under Reporting category. Add this measure in the "Measures" tab by dragging it from the library to the reporting measures sections. You should be able to see the graphical presentation of the results after running the simulation.

The image you are attaching shows ResultsViewer which has been replaced with Data Viewer (DView) in the newer OpenStudio versions. According to the most recent release notes: "Note that PAT and DView are not included in either the SDK or Application installers. You will need to install PAT separately which is distributed on the OpenStudio-PAT GitHub page and DView at the Dview home page."

Some users reported difficulties in using DView and preferred to use timestep which is another EnergyPlus timeseries visualization tool.

edit flag offensive delete link more

Comments

Thank you for your feedback, did what you said and it's worked great!! Cheers

Leon1das's avatar Leon1das  ( 2021-04-27 20:36:13 -0500 )edit
1

Glad that worked for you. If the answer resolved your problem, then please click on the check mark to mark the answer as accepted so that others know that the issue is resolved.

Ammar De's avatar Ammar De  ( 2021-04-27 22:20:49 -0500 )edit

All done Anmar, thanks for the heads up! I'll keep it in mind in future :)

Leon1das's avatar Leon1das  ( 2021-04-27 22:27:18 -0500 )edit

Your Answer

Please start posting anonymously - your entry will be published after you log in or create a new account.

Add Answer

Careers

Question Tools

1 follower

Stats

Asked: 2021-04-20 20:58:33 -0500

Seen: 397 times

Last updated: Apr 27 '21