The schedule applied to your heating setpoint temperature setting of dual setpoint thermostats in all zones is Alwas 0 degree[JTH], which is always 0$^\circ$C.
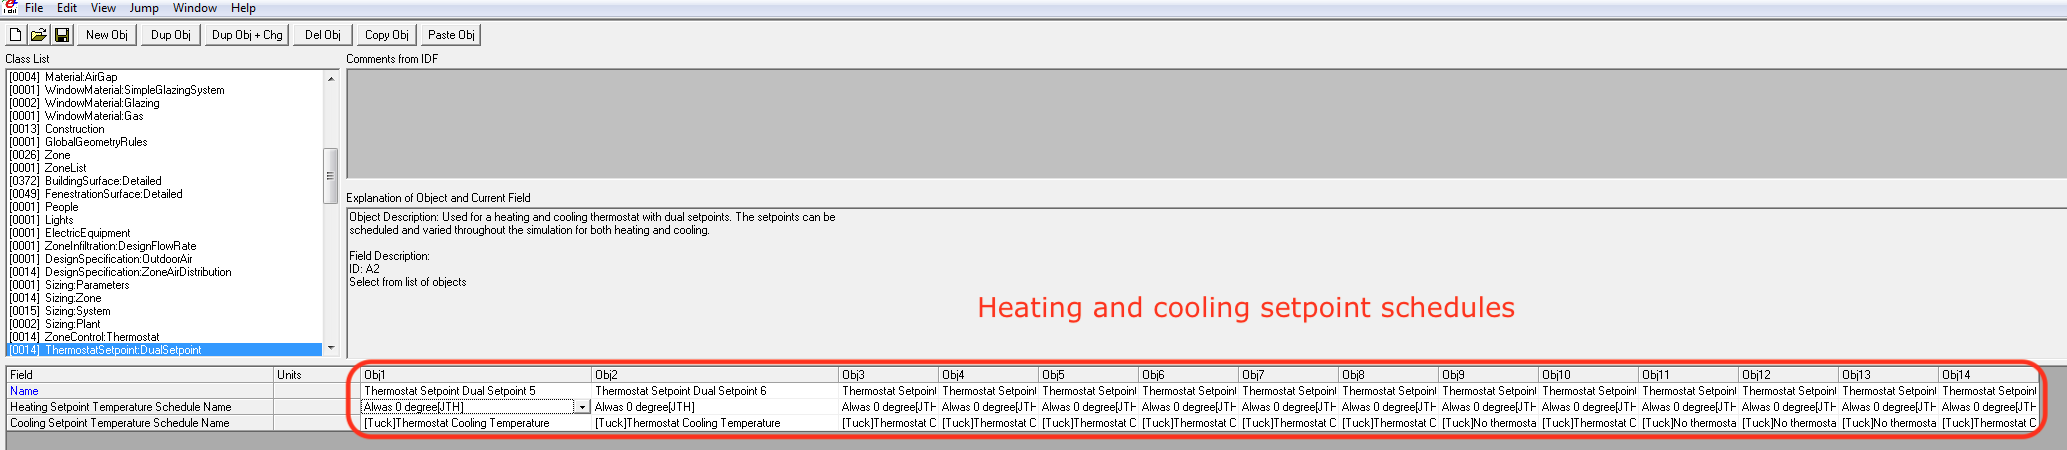
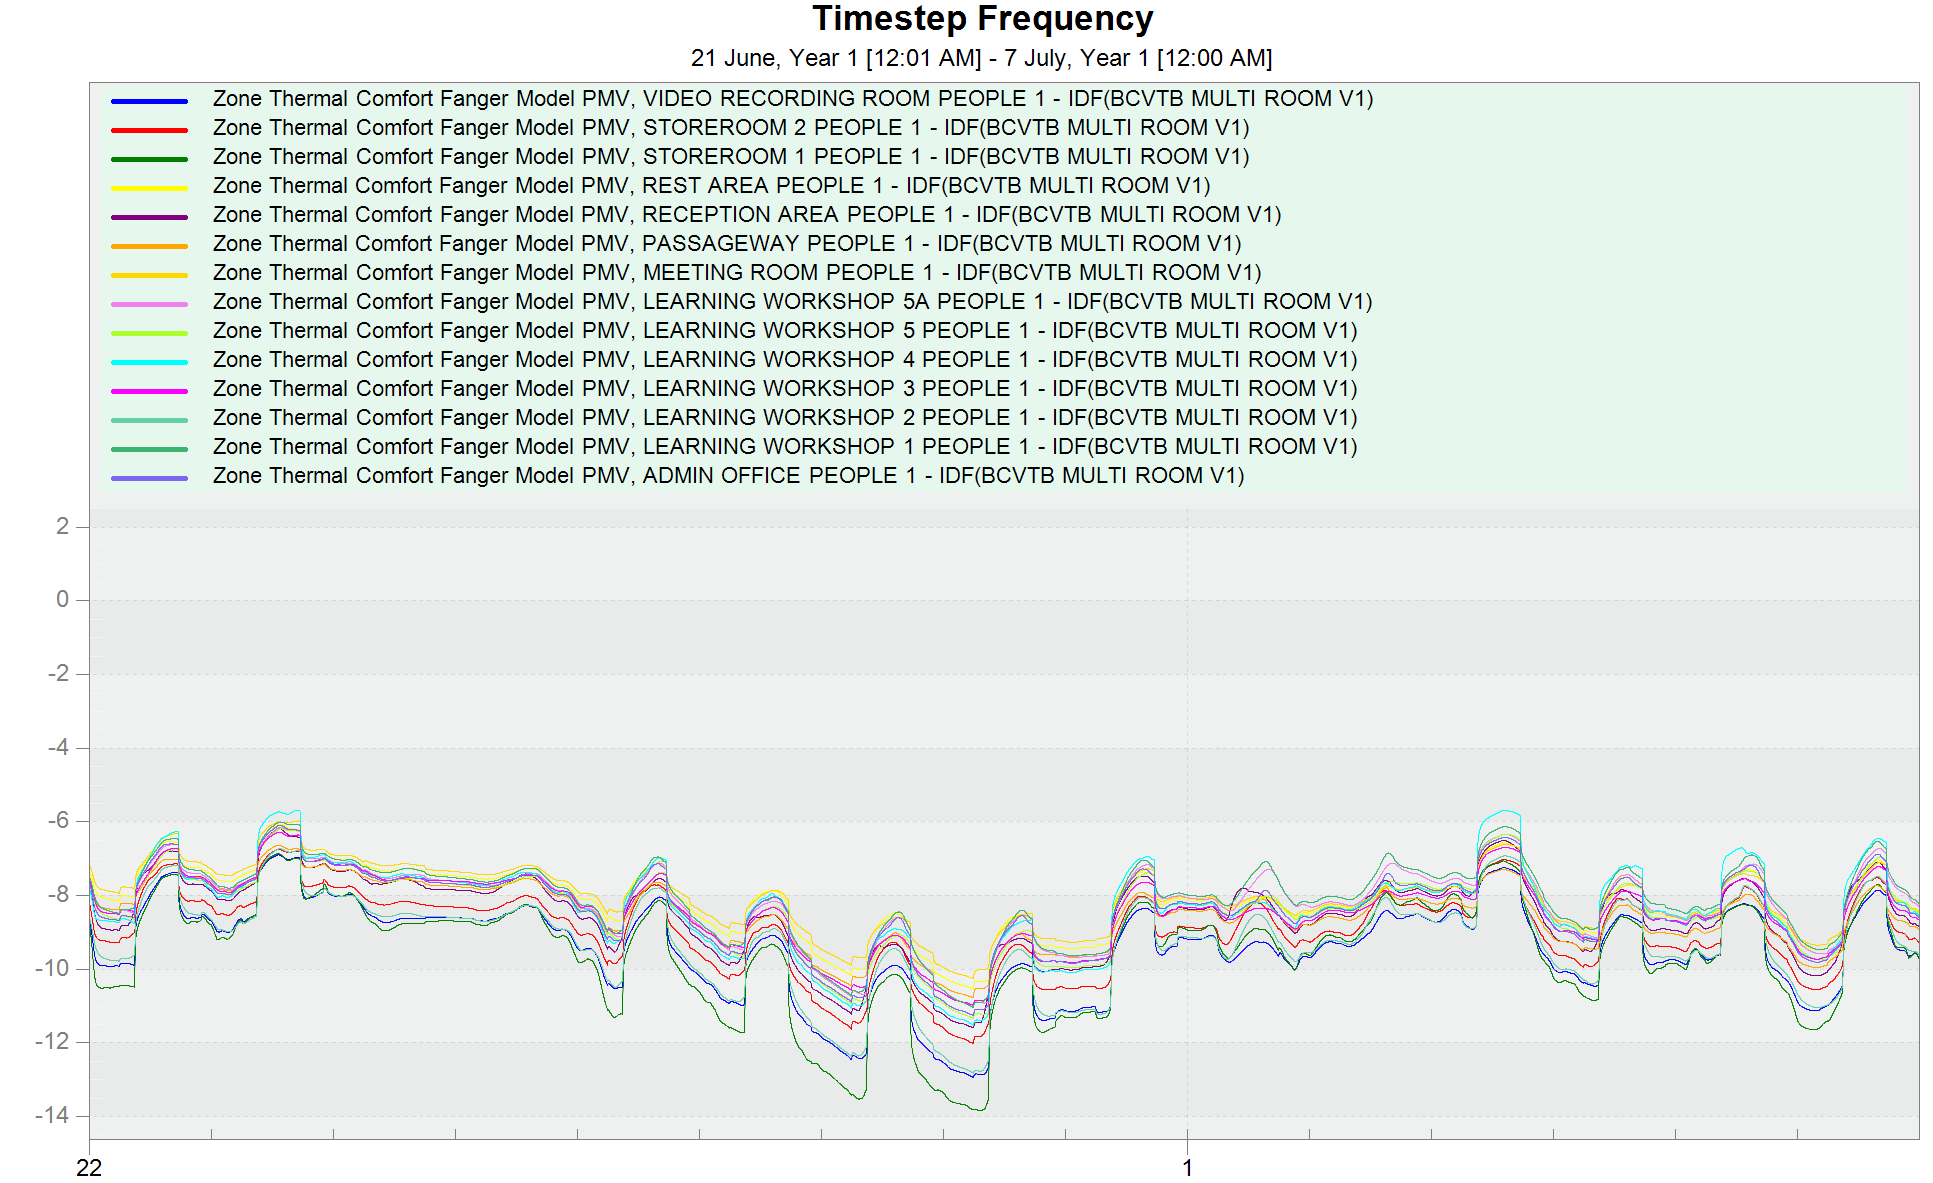
If people are inside of these zones, then that is much too cold and should be more like 22$^\circ$C. My results for PMV are in the -6 to -14 range, so maybe this is an old IDF that you shared? The [Tuck]Thermostat Cooling Temperature schedule applied to the cooling setpoint temperature setting of dual setpoint thermostats in all zones is ~24$^\circ$C, which seems correct.
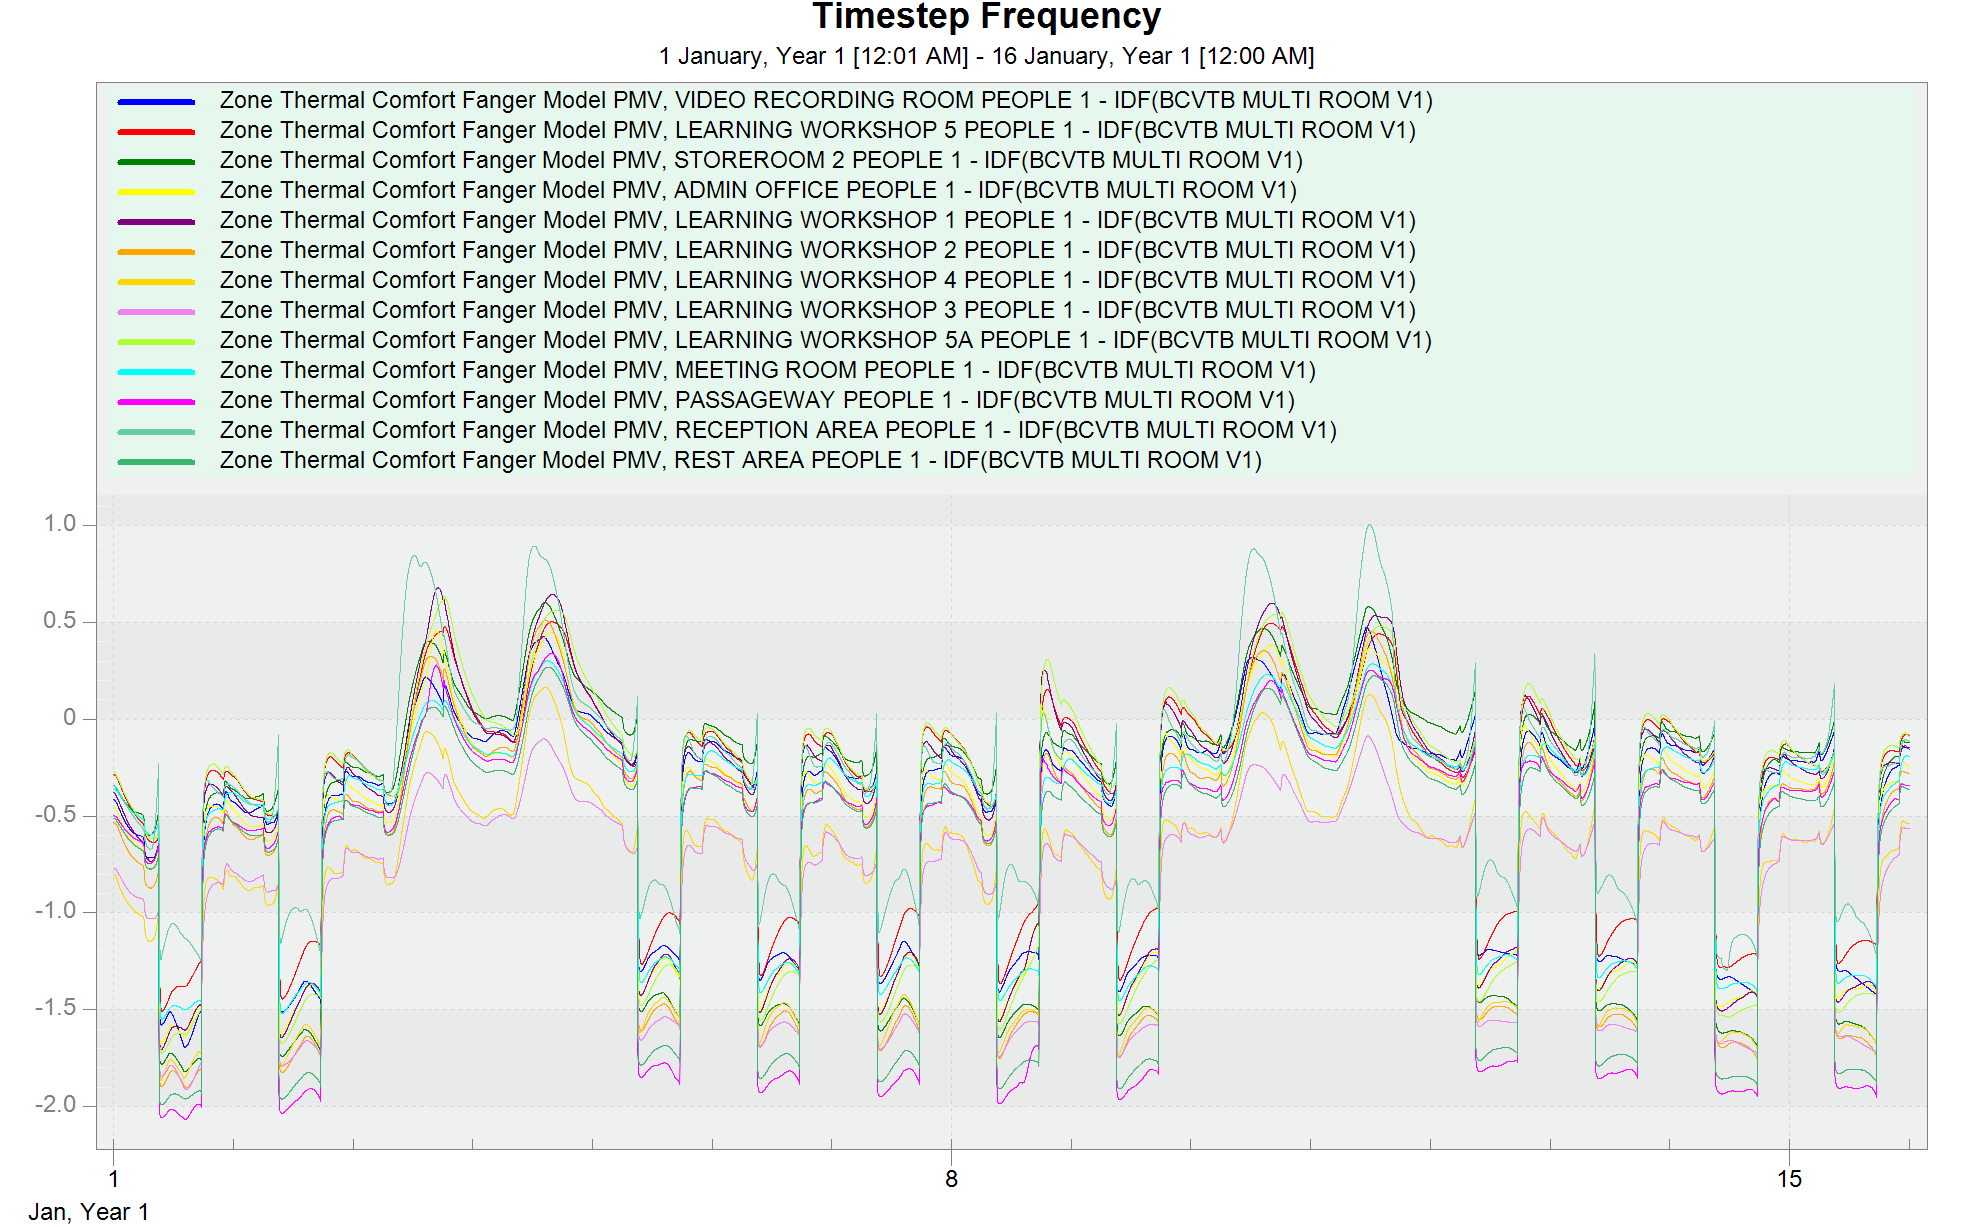
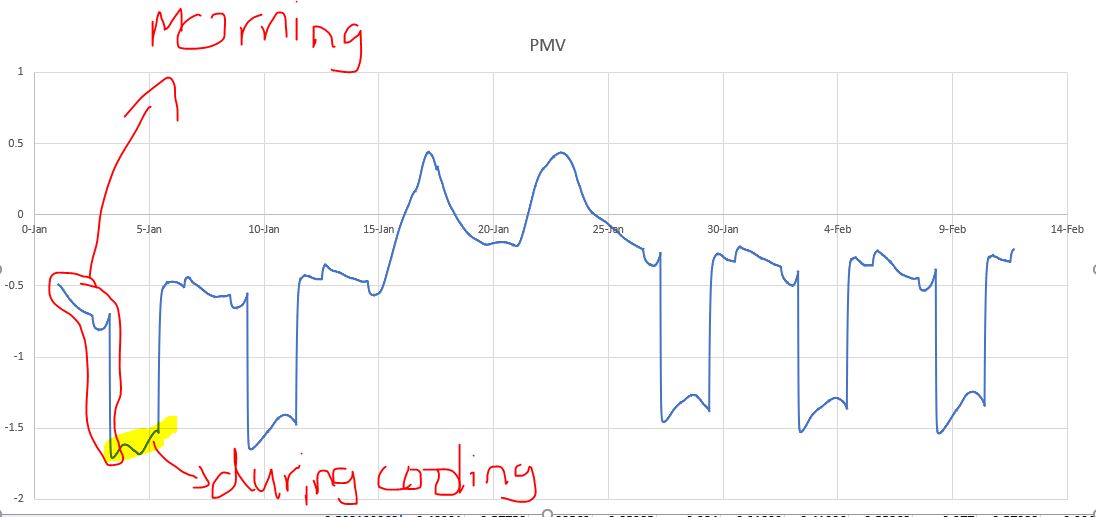
I altered your IDF to apply a constant 22$^\circ$C heating setpoint, and now the PMV outputs are closer to the image in your post (see below) but still having the same quick drops in PMV around 9 AM on weekdays. Weekends actually have better PMV ranges than weekdays.
This made me think that your heating equipment does not have enough capacity to meet the loads in these two weeks of January. It looks like the only thing directly connected to each zone is a VAV terminal unit without reheat, so all the heating in zones comes from the supply air provided by the central air system. However, it looks like each central air system does not contain a heating coil -- only an outdoor air system, constant volume fan, and chilled water cooling coil. So, the central air system is running on the weekdays and mixing in colder outdoor air. Without a heating coil to heat that mixed air, the central supply fan is providing cold supply air to the zones through the terminal units.
It looks like you're using OpenStudio based on how the EnergyPlus IDF that you shared is organized. You apply the thermostat temperature in the Thermal Zones tab and define the HVAC components of central air systems in the HVAC Systems tab.
UPDATE
After more investigation following the comments below, it looks like the central air systems are all over-cooling the zones because they are forced to operate with constant volume fans and a scheduled temperature setpoint of 12$^\circ$C, so you're essentially providing constant cooling capacity to the zones each time the air system operates. This capacity is "autosized" for a specific cooling design day defined in the model -- 0.4% drybulb with mean wetbulb condition for Singapore, in your case. However, that is an extreme case and the system should be allowed to change air flow rate or setpoint temperature to accommodate lower loads that occur in annual simulations. You could fix this by applying other setpoint manager types in addition to the current scheduled-only options (warmest, e.g.) or by changing fans from constant volume operation to variable volume operation.
I have plotted the temperatures at each node as it progresses through this configuration to illustrate this issue.
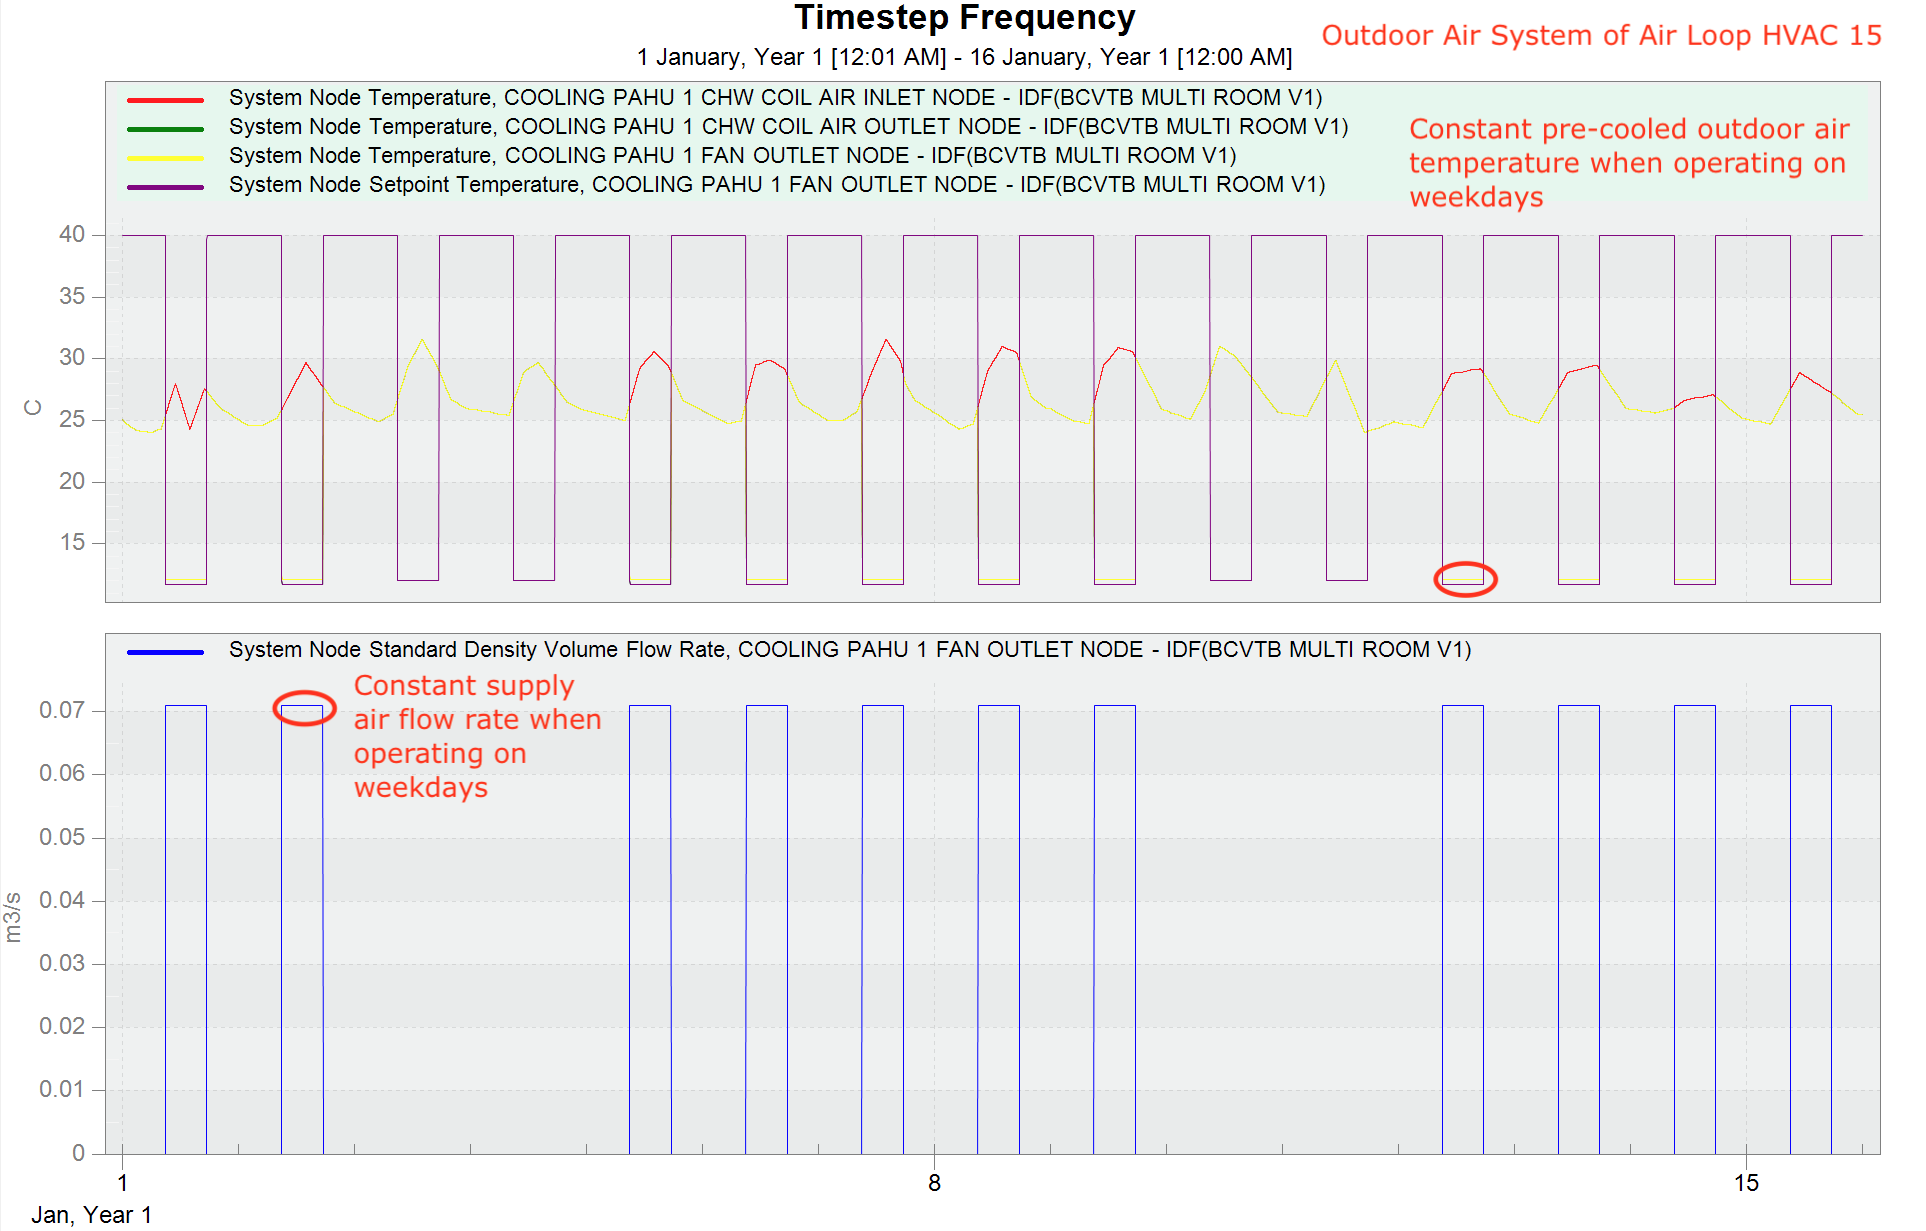 Outdoor Air System of Air Loop HVAC 15, which serves Admin Office Zone
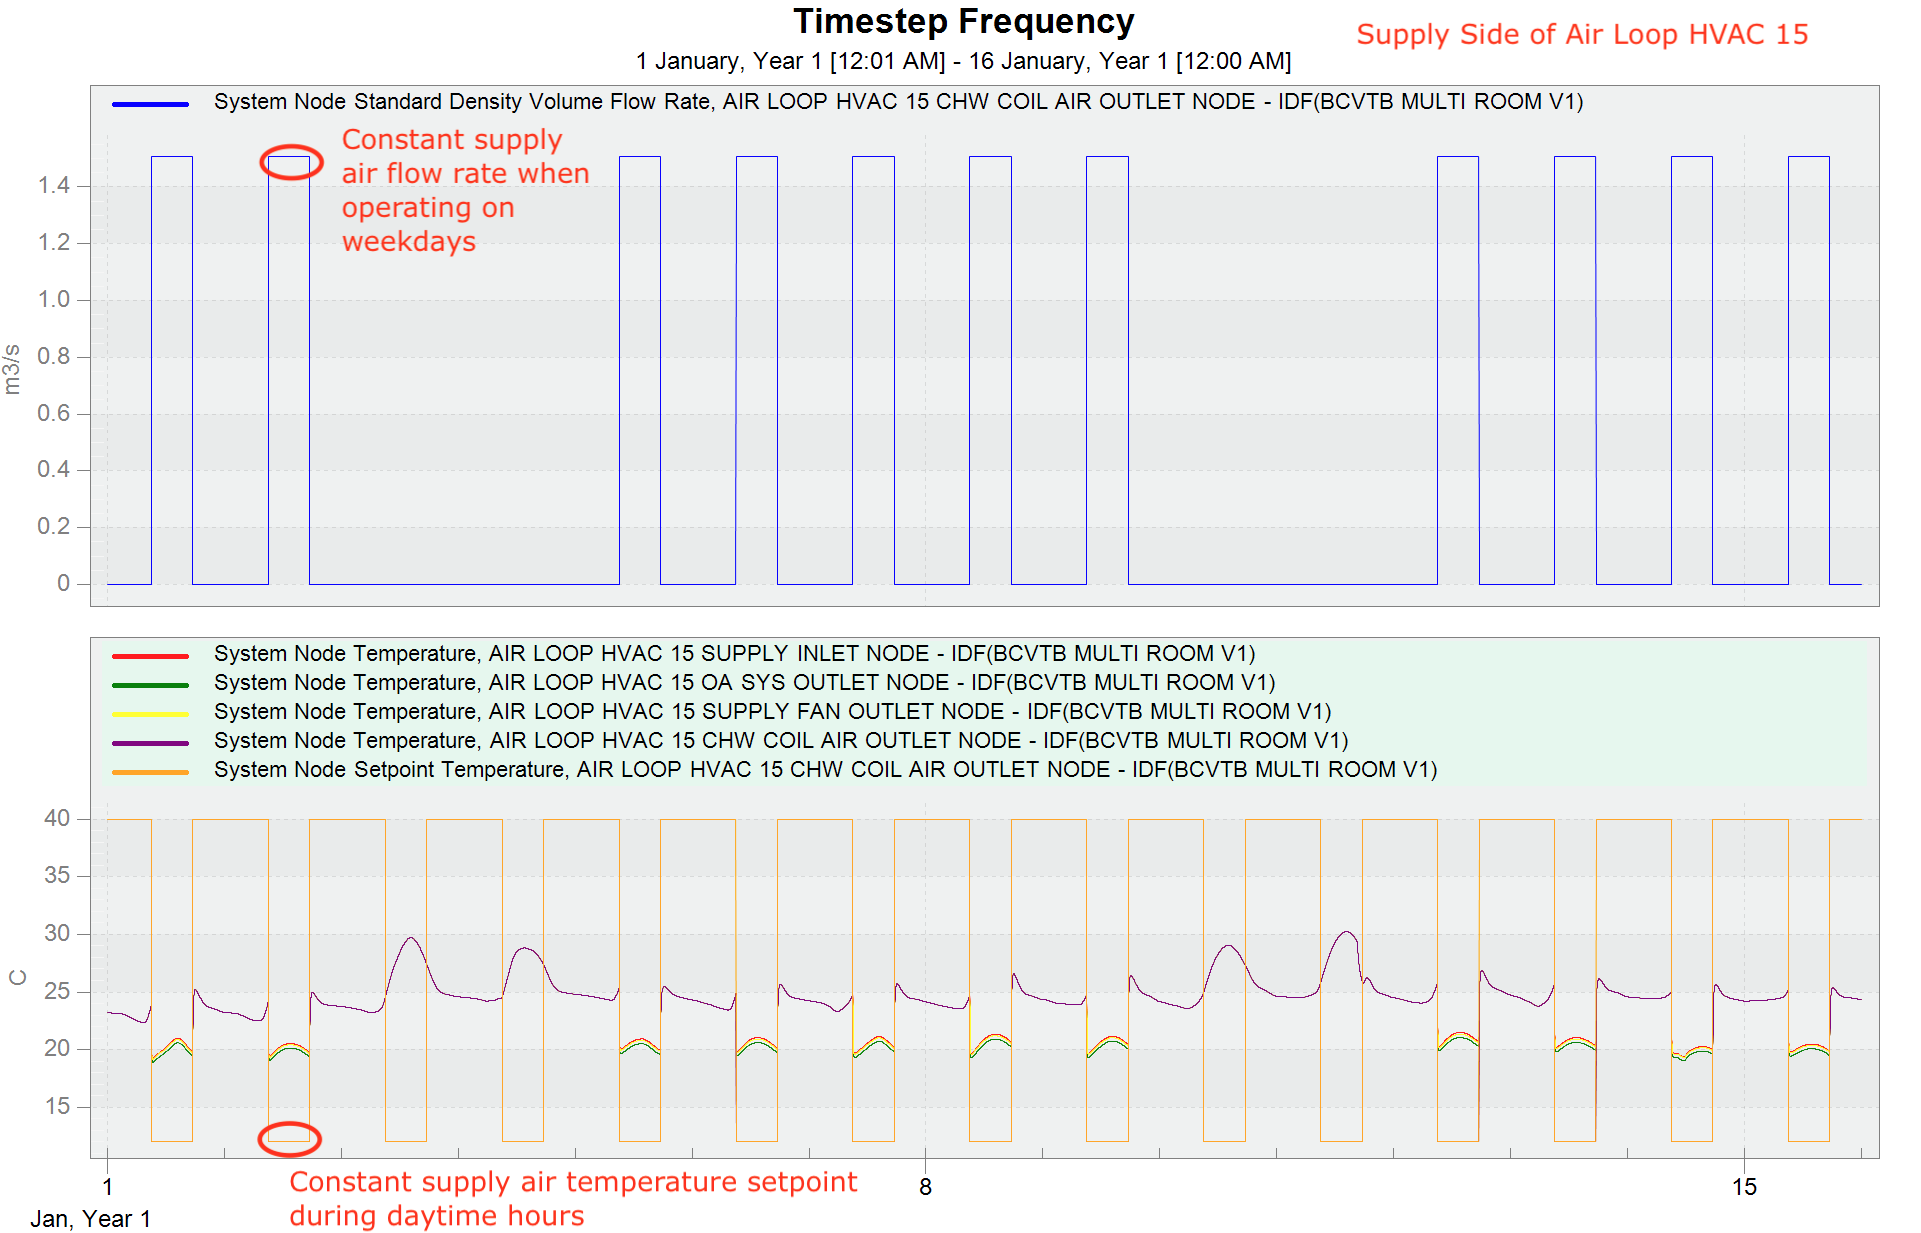 Supply Side of Air Loop HVAC 15, which serves Admin Office Zone ... (more)


I would recommend reviewing this post while you look over your thermal comfort inputs like activity schedule, work efficiency schedule, etc. that are used to calculate PMV. Which thermal comfort model (Fanger, KSU, etc.) are you using?
thank you for the reply. I have check this post. My air velocity is 0.1m/s, clothes insulation is 0.5 clo, work efficiency is 0 and people activity level is 126W/person = 1.2 met and all these are set constant throughout the 24 hours.
I am using fanger PMV. For extra information, I have 14 different thermal zones which uses all the same load definition including the 4 above schedules (air velocity, clothes insulation, work effiency and people activity level)stated for PMV. The graph shown is for 1 thermal zone but all the other 13 zones have the same result which morning have low PMV
Attach is my idf file and I hope you can advice me on this. Thank you.
https://drive.google.com/file/d/1EcCd...