Question-and-Answer Resource for the Building Energy Modeling Community
Get started with the Help page
Ask Your Question
2

Inconsistency in curve calculations

asked 2020-12-03 00:59:25 -0500

updated 2020-12-03 16:42:56 -0500

I found a problem with the curve input/output in my model. The curve is used for chiller performance (EirFTemp). I have reported the following variables:

Output:Variable,Water Cooled Chiller EItoCoolingOutputRatioFofT,Performance Curve Input Variable 1 Value,timestep; !- HVAC Average []
Output:Variable,Water Cooled Chiller EItoCoolingOutputRatioFofT,Performance Curve Input Variable 2 Value,timestep; !- HVAC Average []
Output:Variable,Water Cooled Chiller EItoCoolingOutputRatioFofT,Performance Curve Output Value,timestep; !- HVAC Average []

(since I'm using Chiller:Electric:EIR object, variable 1 is chiller outlet temperature and variable 2 is chiller's condenser inlet temperature) I need to modify the curve output by EMS, so I decided to use sensor variables (chiller outlet temperature & condenser inlet temperature). As you can see in below, I realized the curve is using input variables much different from sensor variables that I'm receiving from energyplus:

image description

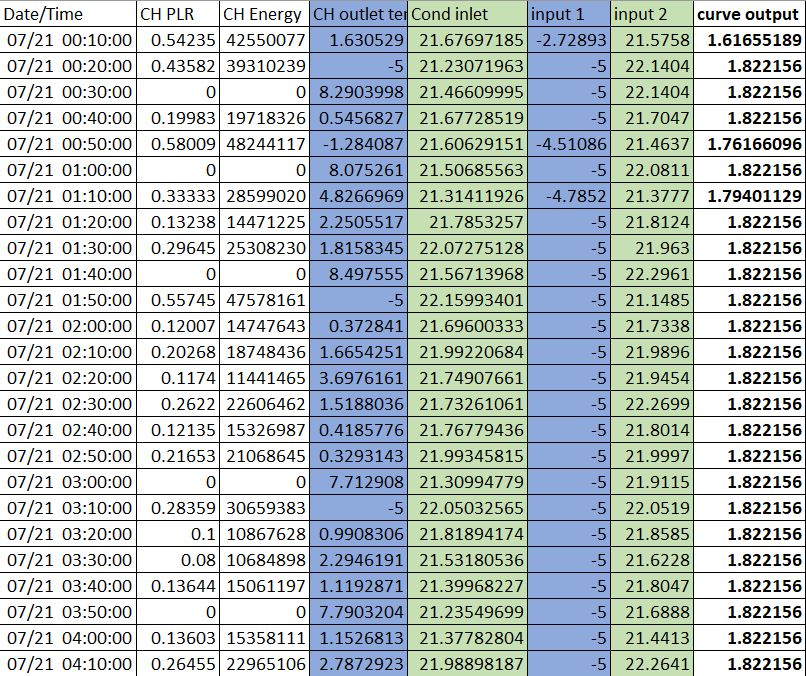
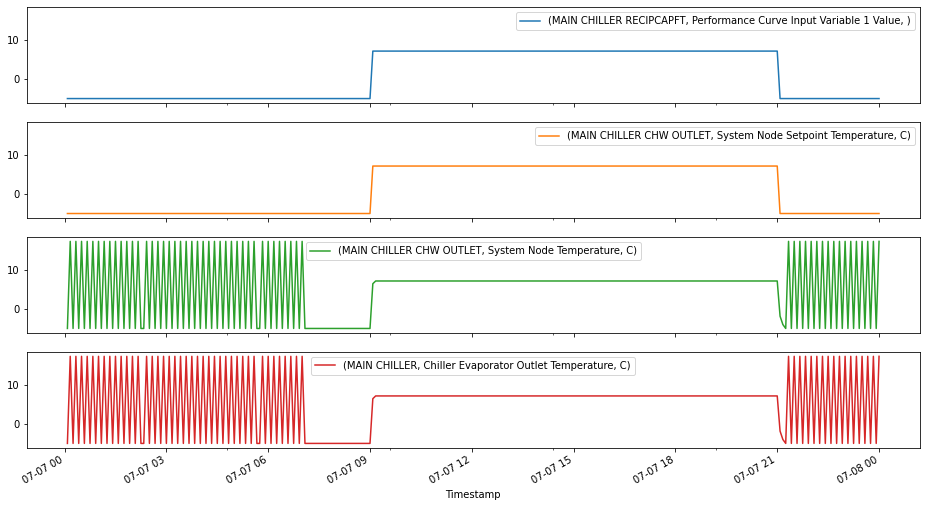
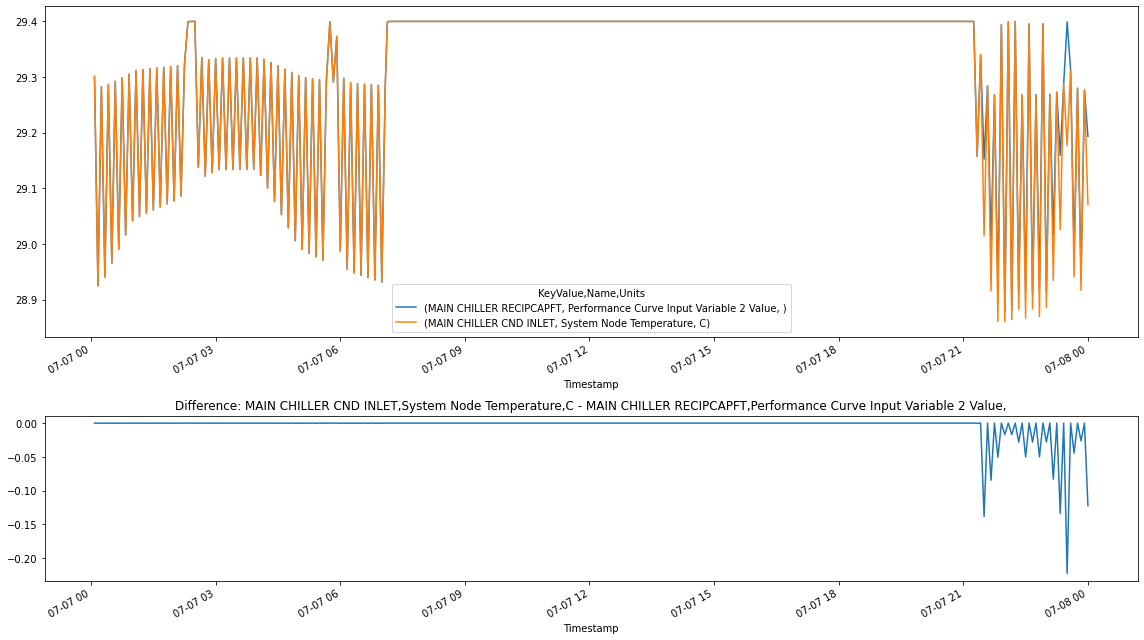
Columns with same color should have a same value (at least with a time lag!). But they are much different specially for the chiller outlet temperature. Why the input 1 of the curve is different from chiller outlet temperature?! Where does it come from?!

Update: I should mention that it happens mostly when the chiller outlet temperature setpoint is negative (e.g. -5).

Update (following my response to Julien): I think I narrowed down the problem. The IceStorage-Series-ChillerUpstream.idf example file works fine because there is no night time load on the secondary side of the loop. I changed the night time setpoint. So chiller should charge (with -5 setpoint) & also provide cooling for the secondary loop (with a 6.7 setpoint). Also, the ice storage outlet has a 6.7 C setpoint all the time. Since there are a two-way common pipe and separate pumpings on the primary and secondary side, having both charging and cooling can't be a problem! Here is files where I compared EnergyPlus example with modified one with nightload.

edit retag flag offensive close merge delete

Comments

Could you share your file or better yet, a minimum complete verifiable example (MCVE) (for eg taking one of the energyplus ExampleFiles as a starting point) please? I'd like to be able to reproduce the issue locally to see what's going on.

Julien Marrec's avatar Julien Marrec  ( 2020-12-03 03:25:19 -0500 )edit

@Julien Marrec, IceStorage-Series-ChillerUpstream.idf is kinda similar to my case, but there is one big issue with this idf! chiller curves have an evaporator limit of 5 while it produces -5 for ice making. I used the curves that I had in my model and the output was FINE! First I don't know why the chiller output temperature is not equal to setpoint (-5) sometimes that PLR is non-zero! Second I don't know why the input for the curves is different from the sensor value!

Mehrdad Vojdani's avatar Mehrdad Vojdani  ( 2020-12-03 14:37:40 -0500 )edit

1 Answer

Sort by ยป oldest newest most voted
2

answered 2020-12-04 09:12:35 -0500

updated 2020-12-04 09:15:15 -0500

First thing to mention is that when you are trying to match HVAC stuff, always request the Detailed (= HVAC System Timestep) frequency, not the Timestep one. You'll avoid many problems where you don't even realize that might be due to the fact that several HVAC timestep may happen within a single (Zone) Timestep.

In this specific case, it may not be a problem since I see the file has Timestep, 12;, but this is a rule you should always follow.

Second, there is a note in the I/O ref that is easy to be missed. Emphasis is mine below, quoting the I/O ref guide here:

Field: Cooling Capacity Function of Temperature Curve Name

The name of a biquadratic performance curve (ref: Performance Curves) that parameterizes the variation of the cooling capacity as a function of the leaving chilled water temperature and the entering condenser fluid temperature. The output of this curve is multiplied by the reference capacity to give the cooling capacity at specific temperature operating conditions (i.e., at temperatures different from the reference temperatures). The curve should have a value of 1.0 at the reference temperatures and flow rates specified above. The biquadratic curve should be valid for the range of water temperatures anticipated for the simulation.

Note: The curve is evaluated at the leaving chilled water (=evaporator outlet) setpoint temperature, not the actual leaving chilled water temperature.

So that's one thing to be aware of. As you can see in the graph below, that explains the discrepancy, and if you use the right variable, you'll get it right

image description


Third, as far as the Condenser Inlet Temperature versus Performance Curve Input Variable 2 Value, I did find a small discrepancy... This might be explained by the fact that curve is evaluated early in the iteration cycle and the actual node temperature ends up slightly different or something, I am not sure and I don't have more time to spare on this.

image description


For reference with the files you supplied, I changed the Output section at the end to be this:

! SENSORS
Output:Variable,*,Chiller Part Load Ratio,Detailed;
Output:Variable,*,Chiller Evaporator Outlet Temperature,Detailed;
Output:Variable,Main Chiller Cnd Inlet,System Node Temperature,Detailed;

Output:Variable,Chilled Water Loop ChW Pri Pump Outlet,System Node Temperature,Detailed; ! ChW Inlet
Output:Variable,Main Chiller ChW Outlet,System Node Temperature,Detailed; ! ChW Outlet
Output:Variable,Main Chiller Cnd Inlet,System Node Temperature,Detailed;  ! CndW Inlet
Output:Variable,Main Chiller Cnd Outlet,System Node Temperature,Detailed; ! CndW Outlet
Output:Variable,Chilled Water Loop ChW Pri Pump Outlet,System Node Setpoint Temperature,Detailed; ! ChW Inlet
Output:Variable,Main Chiller ChW Outlet,System Node Setpoint Temperature,Detailed; ! ChW Outlet
Output:Variable,Main Chiller Cnd Inlet,System Node Setpoint Temperature,Detailed;  ! CndW Inlet
Output:Variable,Main Chiller Cnd Outlet,System Node Setpoint Temperature,Detailed; ! CndW Outlet

! final Multipliers
Output:Variable,*,Chiller Capacity Temperature Modifier Multiplier,Detailed; !- HVAC Average []
Output:Variable,*,Chiller EIR Temperature Modifier Multiplier,Detailed ...
(more)
edit flag offensive delete link more

Comments

@Mehrdad try to investigate the discrpancy in the Varable 2 Value, and if you think it's a bug, open an issue on https://github.com/NREL/EnergyPlus

Julien Marrec's avatar Julien Marrec  ( 2020-12-04 09:13:32 -0500 )edit

Thank you @Julien Marrec for your time. I really appreciate it. You are absolutely right about capacity function of temperature curve. I hope the problem with EirFT and EirFPLR curve inputs could be solved by further investigation.

Mehrdad Vojdani's avatar Mehrdad Vojdani  ( 2020-12-04 13:54:46 -0500 )edit

Your Answer

Please start posting anonymously - your entry will be published after you log in or create a new account.

Add Answer

Careers

Question Tools

2 followers

Stats

Asked: 2020-12-03 00:59:25 -0500

Seen: 255 times

Last updated: Dec 04 '20