How to solve the burr in temperature simulation


I'm a novice.
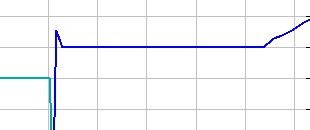
I am doing a simulation of the indoor temperature, but the temperature curve will show burrs when the temperature is controlled. So why is that?


@YAQ it doesn't look like the image you wanted to post came through correctly. Could you please update your post to include the image?
thank you for your answer.I'm a novice.I have updated the image.
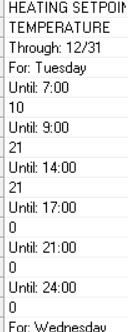
I doubt that my heating setpoint time is early.the specific parameter setting shown in image.What do you think of this question
@YAQ there are no axes on your chart image, so it's hard to tell what the temperature values are and what hours they occur. It might be easiest if you share your EnergyPlus input file ending in .idf (download link using Dropbox, Google Drive, etc.) so that others can help.
I used the BCVTB and energyplus,so it's not the specific time.the burr appear the 7:00-9:00 am. I doubt that it's the time question .when I set the time in 8:00-9:00 the burr disappar.