Discrepancy in heating/cooling energy use when comparing PAT outputs using different EPWs to represent same general area


Hi all.
Specific details of my system: using ResStock v2.2.4 with OpenStudio/PAT v2.9.0. I am trying to model a specific residential community in Georgia. I have obtained two different EPW files to represent the territory. One EPW file is from Blairsville GA, which is more representative of the community, and the other EPW file is from Andrews NC Airport. Ideally, I would just use Blairsville EPWs for my analysis, but unfortunately they only have 1 year of data (2008). Andrews NC has 10 years worth of data, including 2008.
I created two sets of results.csv files, one per EPW file, both for the year 2008. Based on the relative proximity of the EPW stations, I expect the results to be very similar. Ideally, in order to use Andrews EPW files for my analysis, the results should match those using the Blairsville EPW as close as possible. I fixed the heating equipment to be Electric Baseboard and the cooling equipment to be a SEER 8 AC in the Apply Upgrade measure for both simulations.
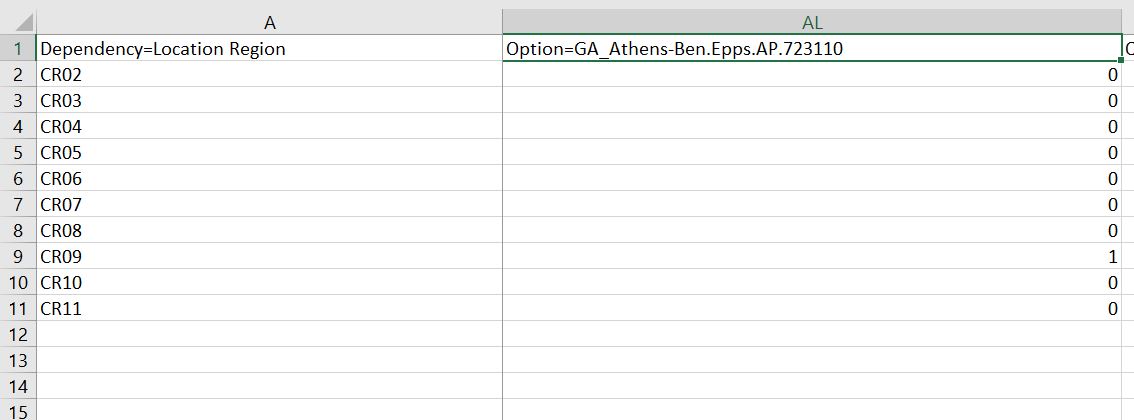
In order for PAT to recognize the EPW file, I had to rename both EPW files to 0979938_US_GA_Clarke_13059_0-20000-0-72311_33.97_-83.34_NSRDB_2.0.1_AMY.epw before zipping the files and creating direct download links for input in PAT. I additionally specified the nearest location I could find in the Location.tsv file, which was Athens-Ben Epps Airport:
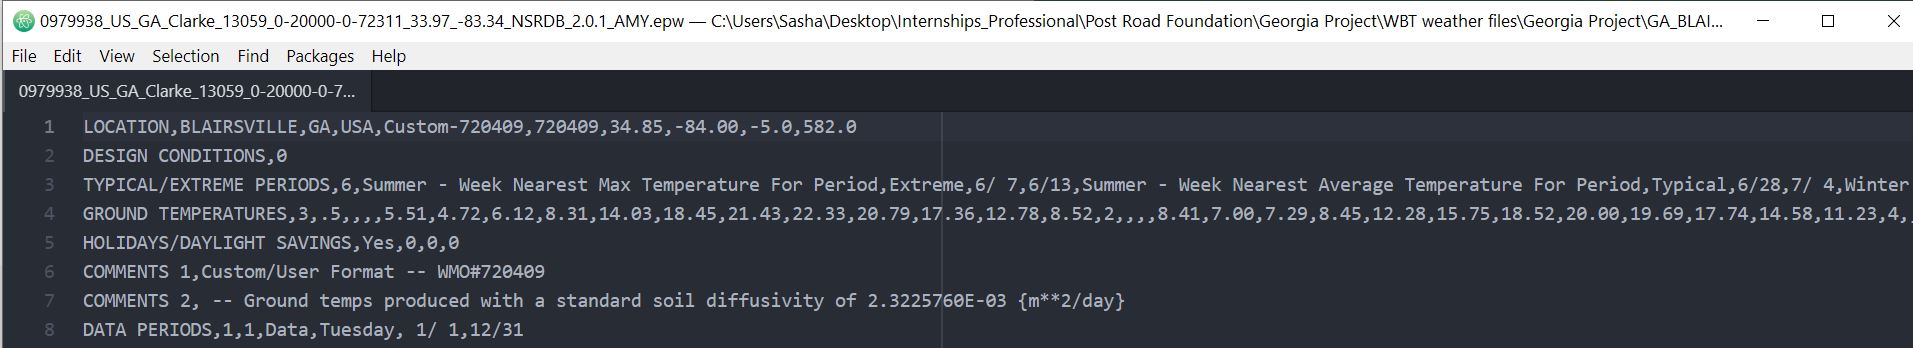
I also specified AMY = 1 in Location Weather Year TSV file in housing_characteristics, and edited the EPW so that PAT would recognize it as a leap year by changing "No" after DAYLIGHT SAVINGS 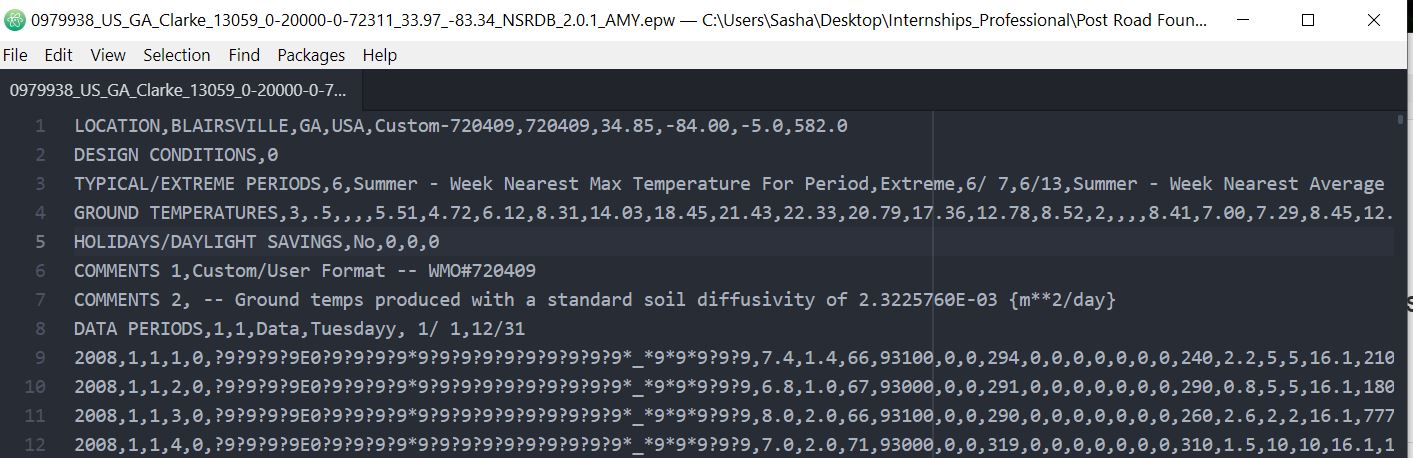
to "Yes" (Tuesdayy to Tuesday was also corrected).
Additionally, after running simulations I checked that the data was sorted by increasing building i.d. #, and that the building characteristics (vintage, geometry, insulation etc) were the same in both simulations. This was done to ensure that buildings were compared "apples to apples" and that no confounding factors by comparing buildings with different physical properties.
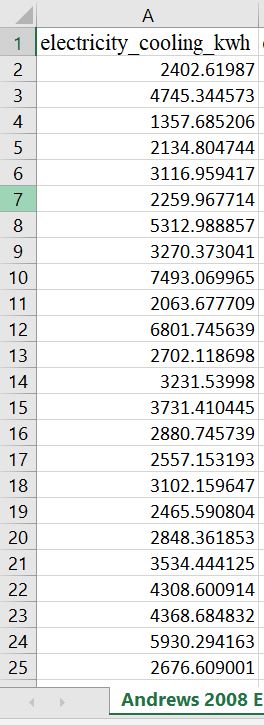
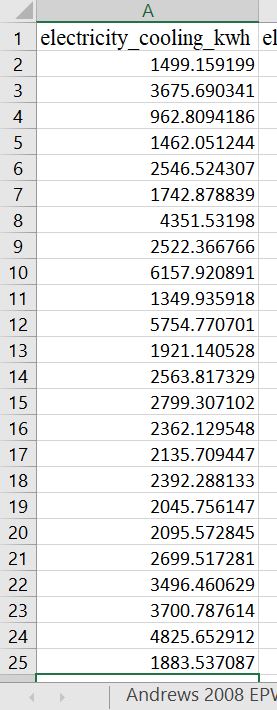
When looking at the results for heating and cooling energy use fields, there is a large discrepancy between values. I quantified this error by calculating the absolute difference between values, and dividing by the blairsville-value ie abs(andrews_value-blairsville_value)/blairsville_value. Using data presented below, a sample calculation would be abs(2402 kwh-1499 kwh)/1499 kwh = 0.602. The "percent error" for cooling_electricity_kwh can be as large as 0.70 (70%), which does not bode well if I am trying to say that Andrews EPW file is representative of the community. Below is a column of cooling_electricity_kwh using Andrews EPW:
Below is a column of cooling_electricity_kwh using Blairsville EPW:
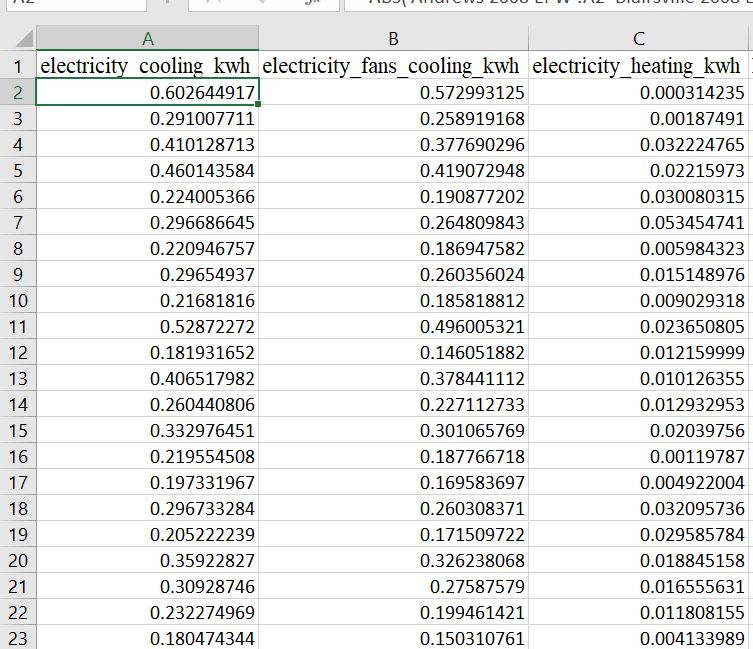
Below is percent error calculated via specified formula for electricity_cooling_kwh:
It is totally possible that difference between the weather files is causing this discrepancy between results, in which case I would just need to qualify that in my research or find different weather files other than Andrews AP to model the community.
What else could explain such a large discrepancy between the results ...


Have you compared the temperatures and solar radiation between the two EPWs? It's also not clear from your description if you're using weather data from the same year (i.e., 2008) in the two EPWs, since you mention that one of the locations has 10 years worth of data.
2 simulations were done, both for 2008. When looking at temperature and solar radiation, would it be enough to consider an annual average value? I can also try to plot the time-series itself on top of each other, but I am not sure how to get EPW format into a CSV format to import into python for plotting. Anyone know how to do that?
Additionally, when looking at temperature, should I be looking at Dry Bulb Temperature, Wet Bulb Temperature, or Dew Point Temperature? I have a vague understanding of what these are from atmospheric science classes but I don't understand what they mean in the context of residential energy models.
How did you specify that the simulation is for 2008? That does not necessarily mean that weather data from 2008 is used. And to visualize EPW weather data, you can use the DView or Elements software.
I am using Elements to visualize the data, and am creating line charts of various fields overlayed on top of each other to see where the EPW files differ. It looks like there is similarity across the board except for a period where solar radiation drops a lot for Blairsville. This is probably why cooling energy use is larger for Andrews!