Question-and-Answer Resource for the Building Energy Modeling Community
Get started with the Help page
Ask Your Question
2

PAT 2 log file location

asked 2020-04-22 12:09:27 -0500

Abekhit's avatar

updated 2020-04-23 14:42:51 -0500

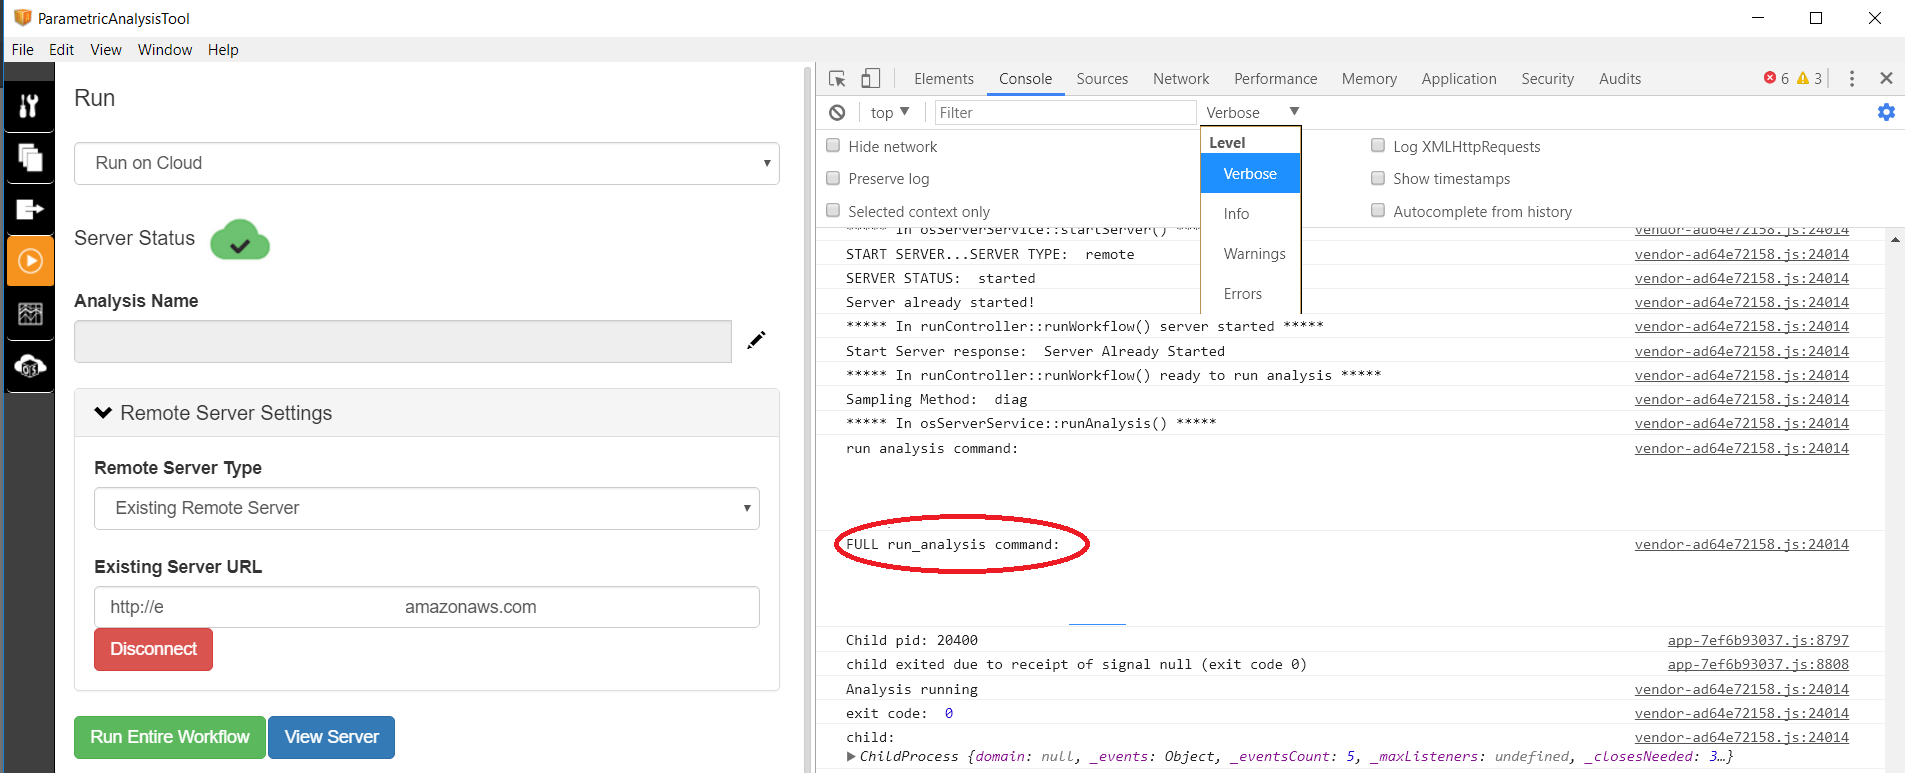
I'm looking into using scripting to run the analysis on an OSServer. I followed JS files and been able to boil it down to this line which runs the analysis. I noticed there're log after every command and all of that should be stored in a file somewhere. For that line specifically, it's followed by if (vm.Message.showDebug()) vm.$log.debug('FULL run_analysis command: ', full_command);

My questions are:

  1. where can I find the log file which shows the full_command (I installed PAT as part of the latest 2.9 OS installer)

  2. What's the best way to use scripting to automate the workflow and bypass PAT?

    2.1 Create project Json/Zip

    2.2 Run analysis on already started server

Thanks

edit retag flag offensive close merge delete

2 Answers

Sort by ยป oldest newest most voted
2

answered 2020-04-23 12:05:42 -0500

@Abekhit this isn't something that we publicly support at all, but I have setup a repository that shows workflow that converts OSW to OSA json and sets up the ZIP file as well. The bottom of the readme shows how run the meta-CLI which will run an OSA on an already running server https://github.com/DavidGoldwasser/os...

Note, that PAT does need to be installed, and, unless you enter full path in the command line, you need to setup environmental variable, or on mac line in .bash_profile that looks like this export PATH="/Applications/OpenStudio-2.9.1/ParametricAnalysisTool.app/Contents/Resources/OpenStudio-server/bin":$PATH

edit flag offensive delete link more

Comments

Thanks @david-goldwasser. I want to create project using PAT the first time then edit/tweak it as needed. If we expanded scope, we'll use OSW2OSA.

Abekhit's avatar Abekhit  ( 2020-05-06 08:29:51 -0500 )edit
1

answered 2020-05-06 08:27:49 -0500

Abekhit's avatar

Changed the console log level to Verbose and info and debug were printed. The window on the right is from view > Toggle Developer Tools.

image description

edit flag offensive delete link more

Your Answer

Please start posting anonymously - your entry will be published after you log in or create a new account.

Add Answer

Careers

Question Tools

Stats

Asked: 2020-04-22 12:06:38 -0500

Seen: 131 times

Last updated: May 06 '20