Question-and-Answer Resource for the Building Energy Modeling Community
Get started with the Help page
Ask Your Question
2

EPW data looks incomplete

asked 2020-03-15 13:03:36 -0500

tenna031's avatar

updated 2020-03-15 15:41:34 -0500

Hi folks,

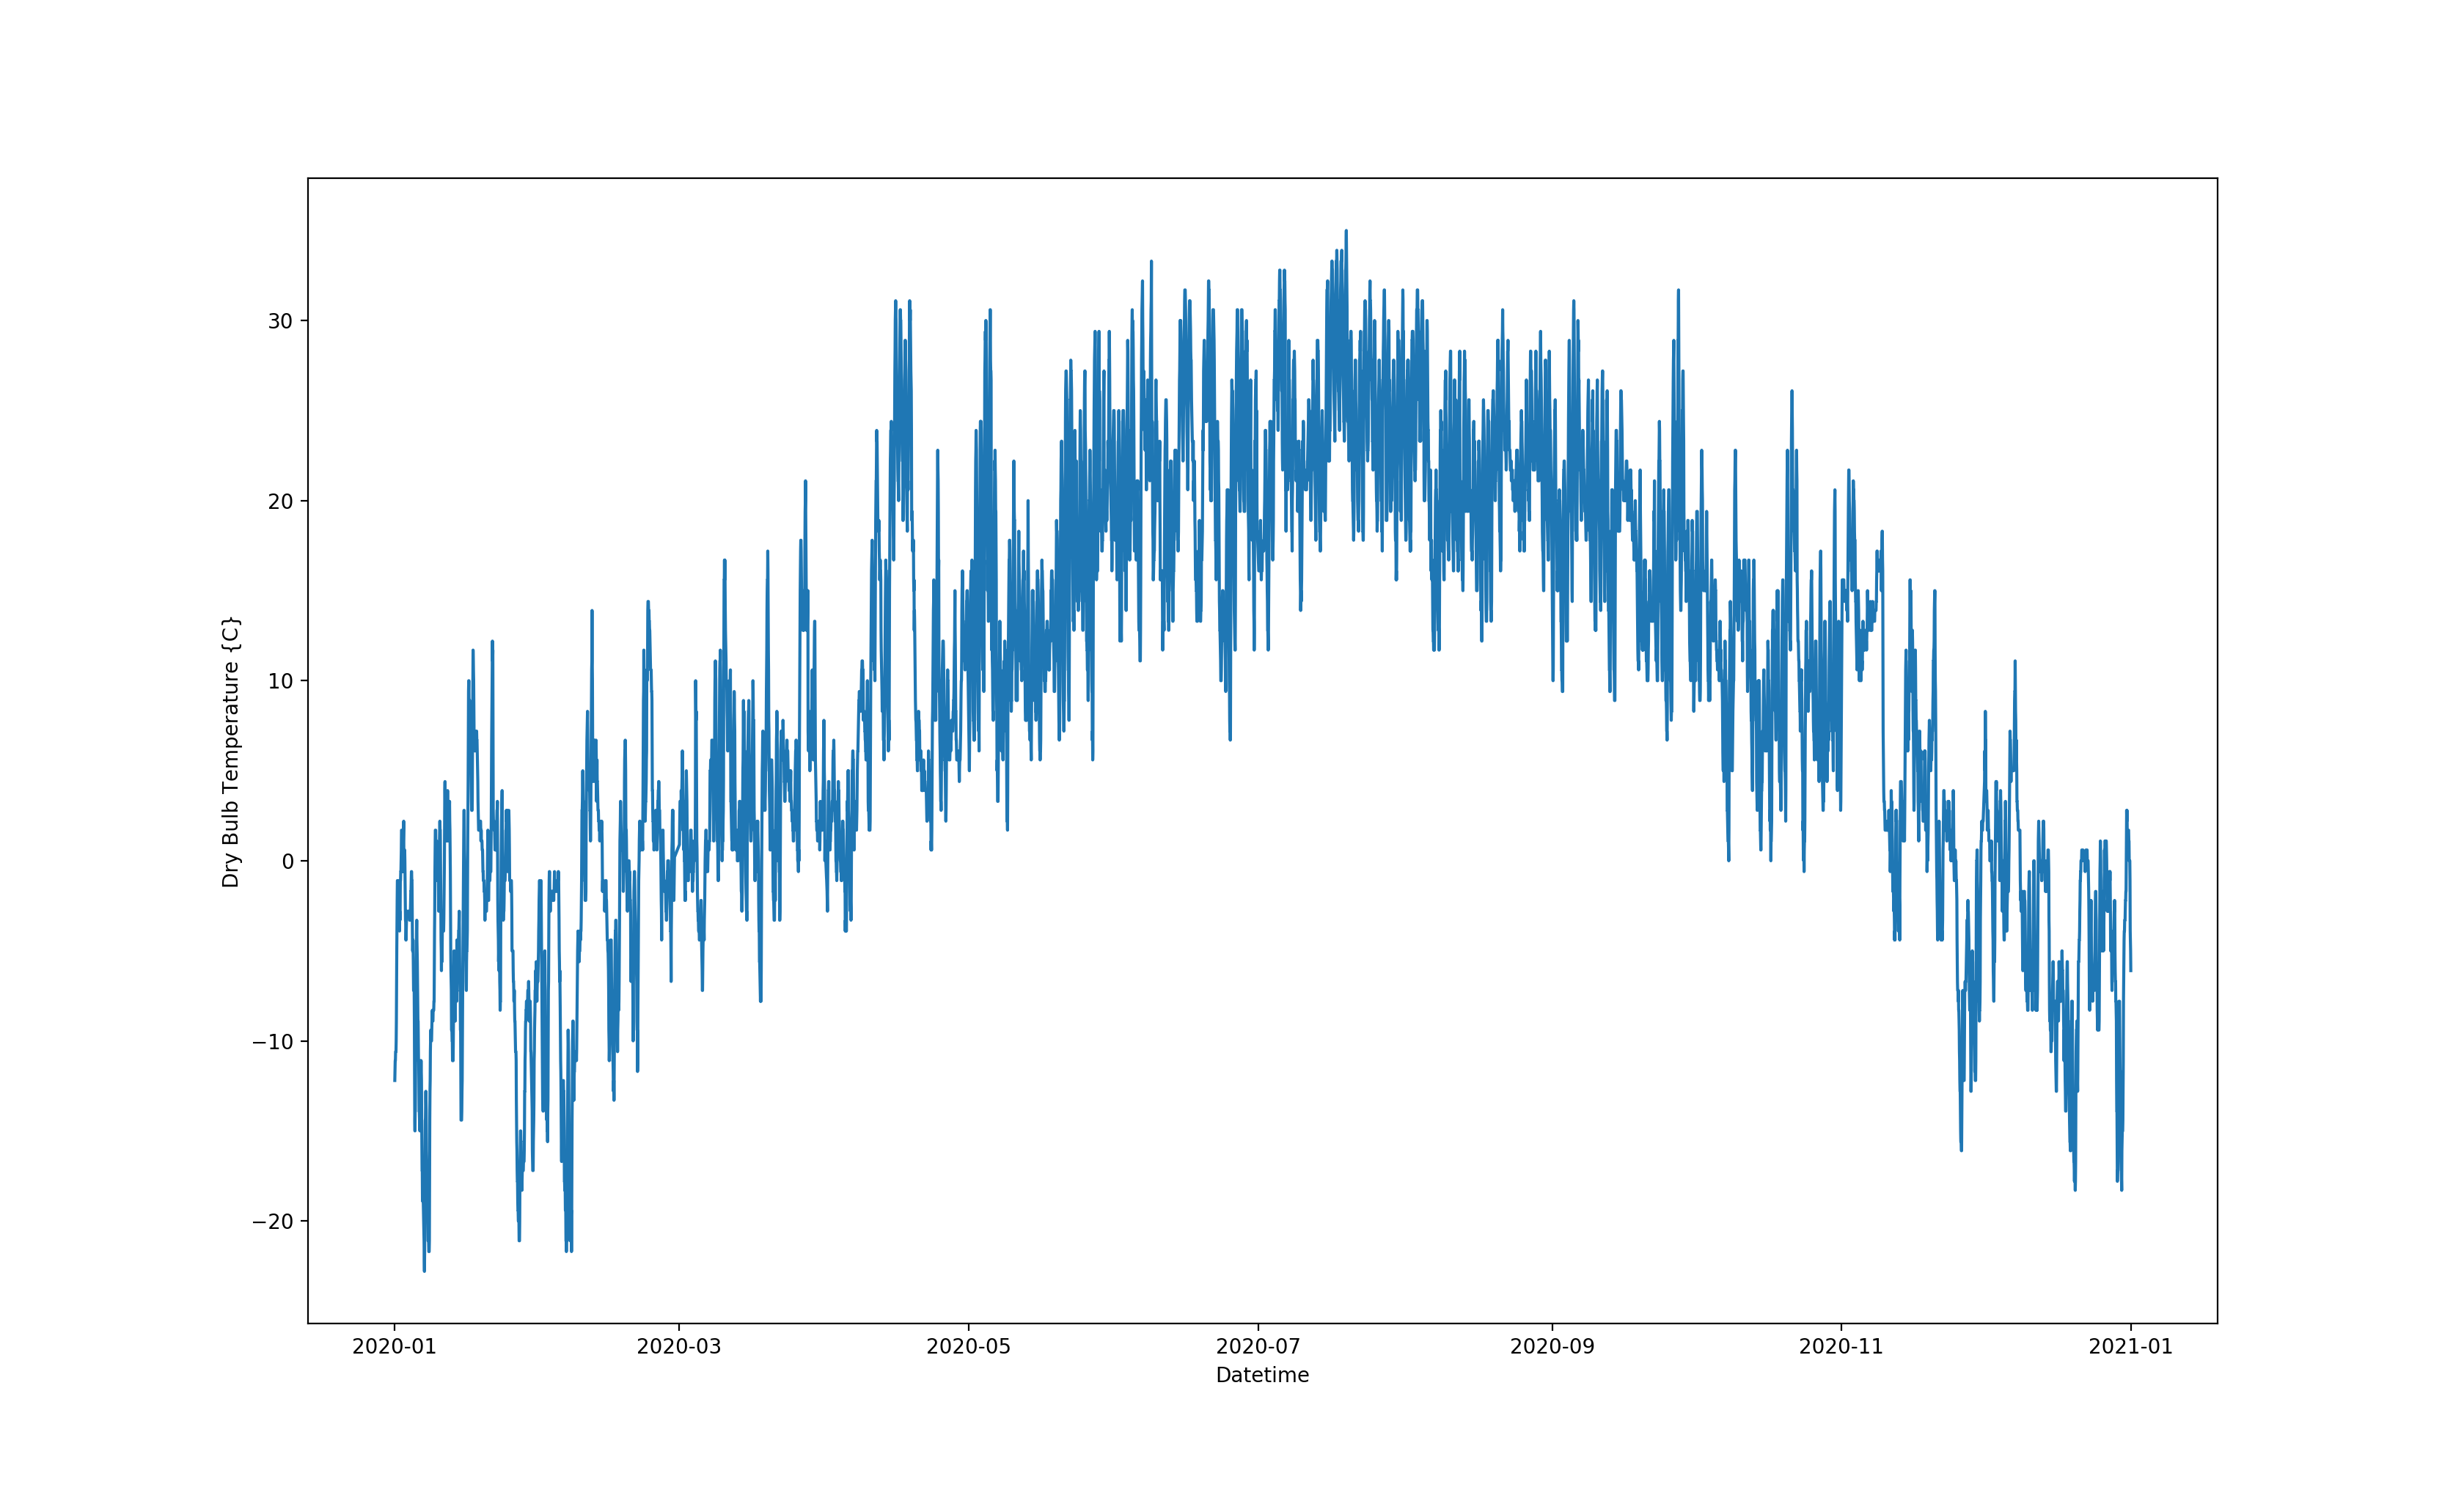
When I apply a Whole Building measure on OpenStudio and load an EPW file, I get the following warning about incomplete weather data:

image description

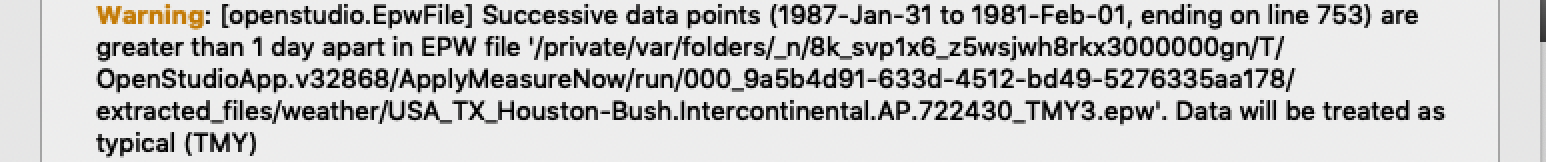
Looking at the actual weather file, I see some pretty sparse data:

image description

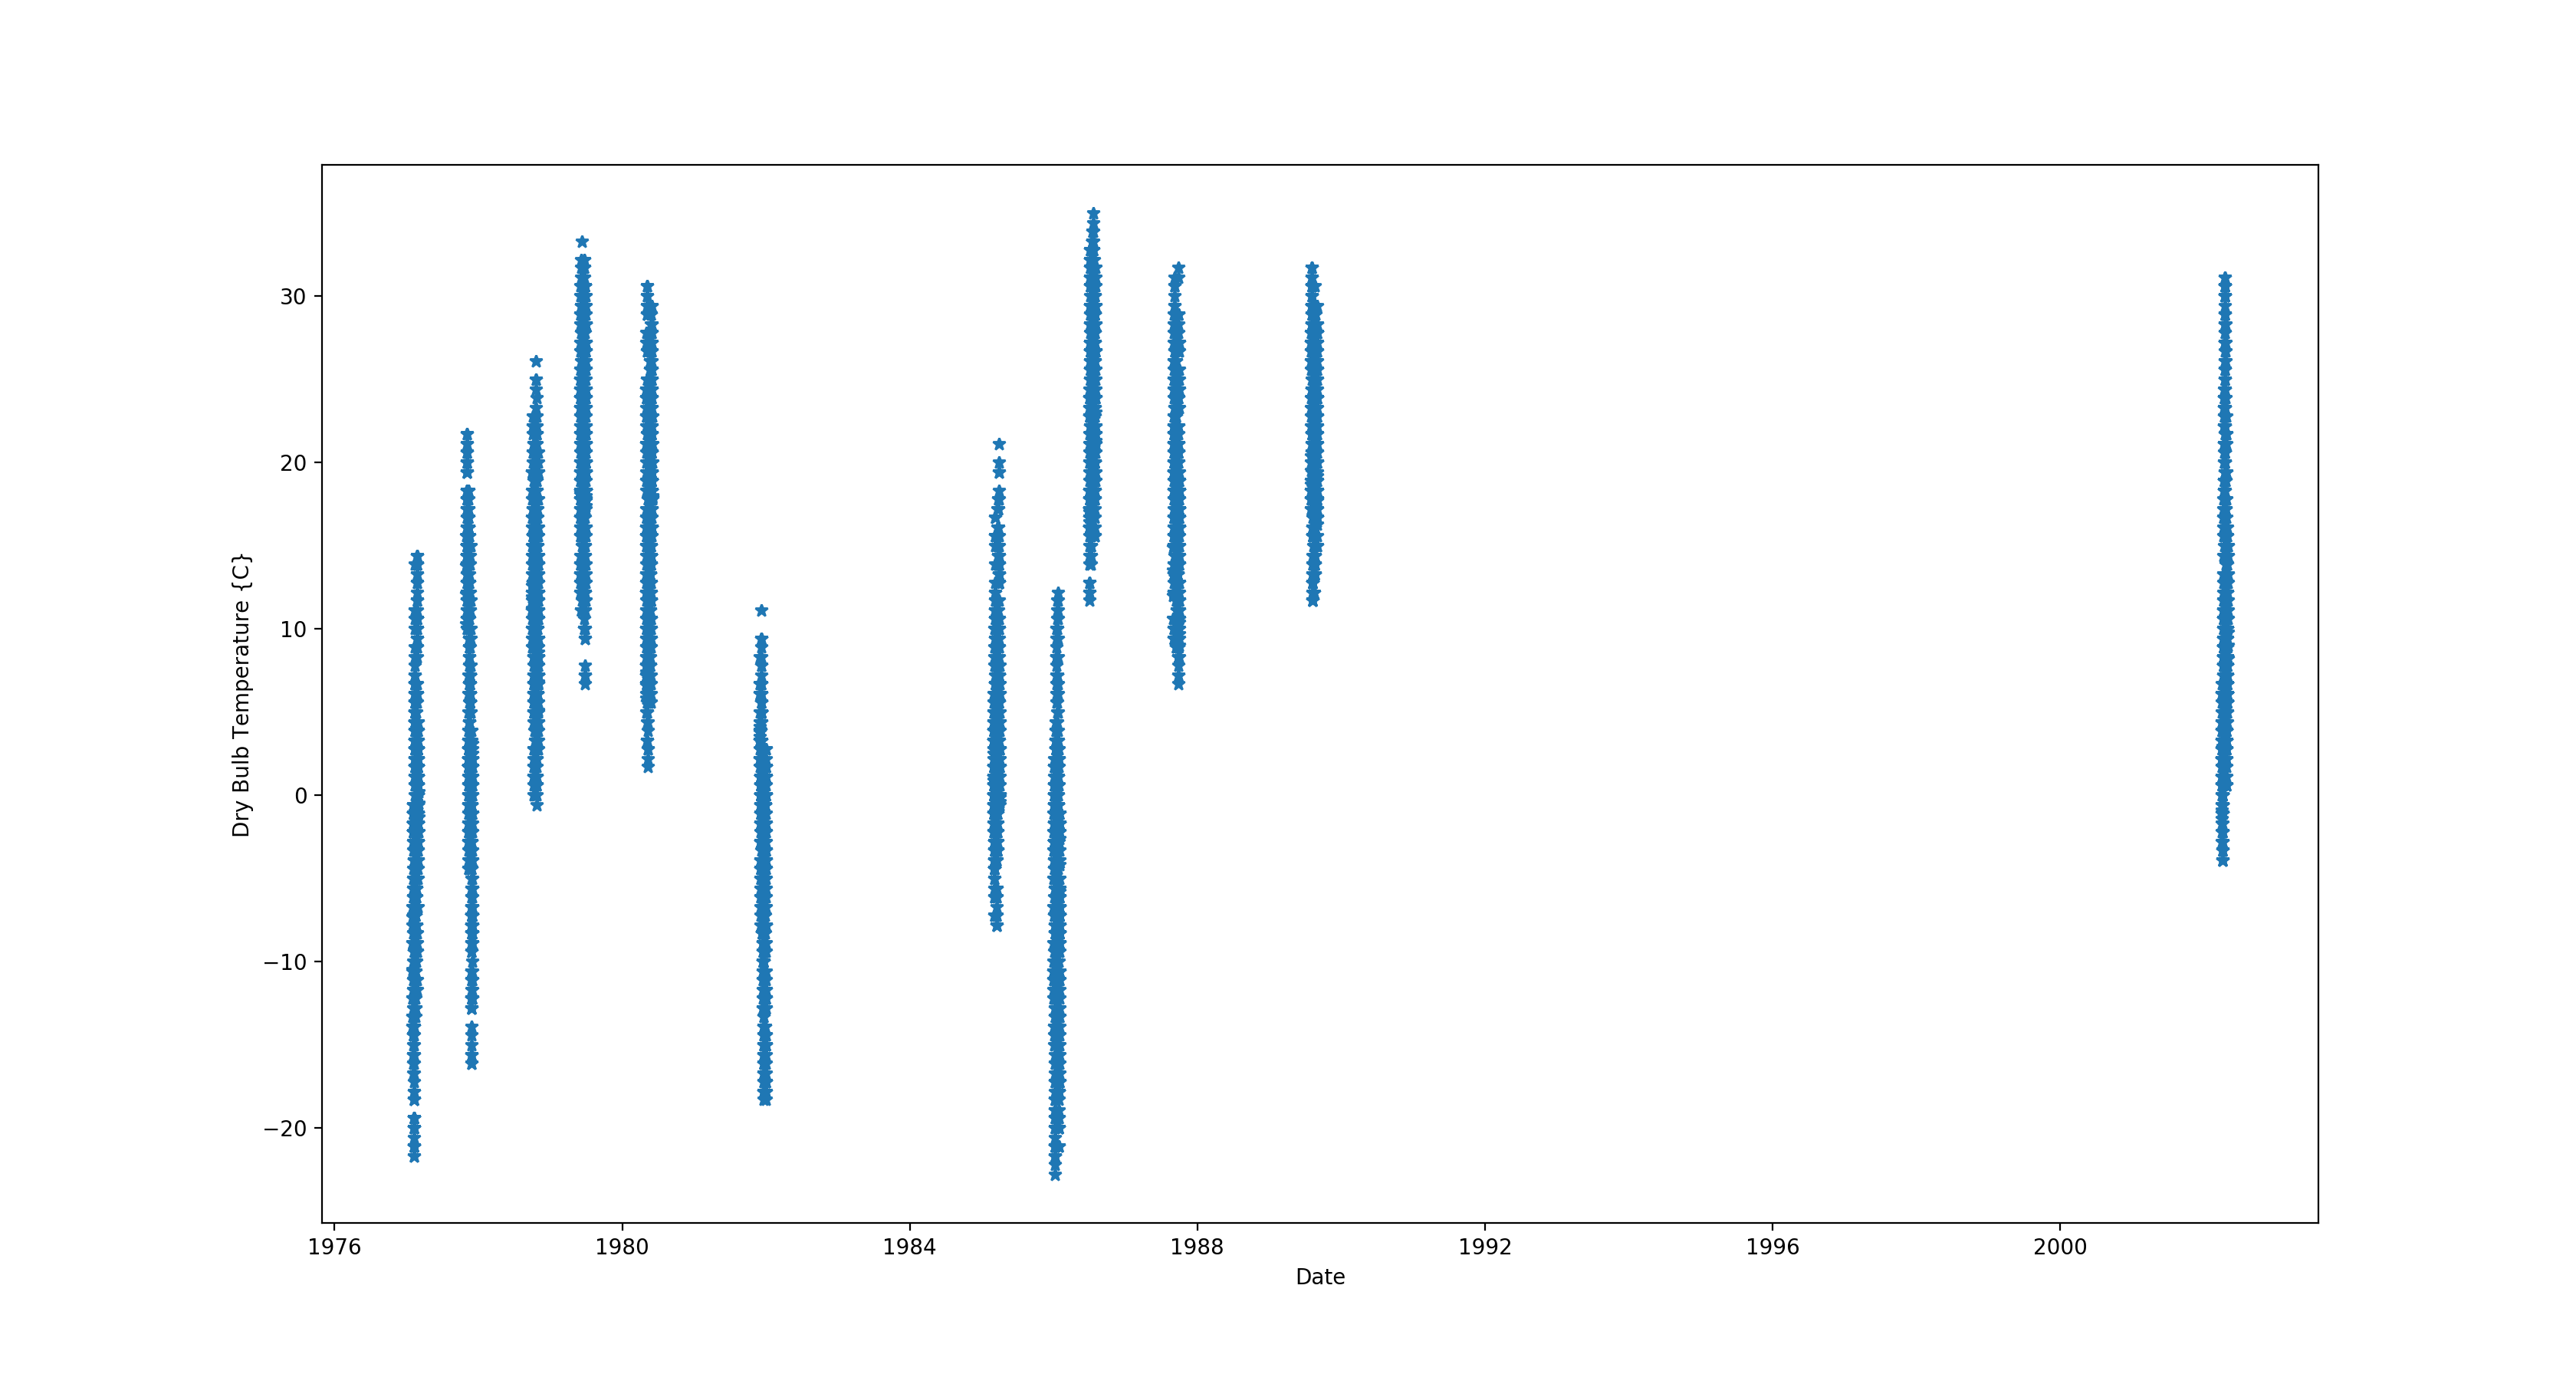
..with the last segment being 2002 data over a month:

image description

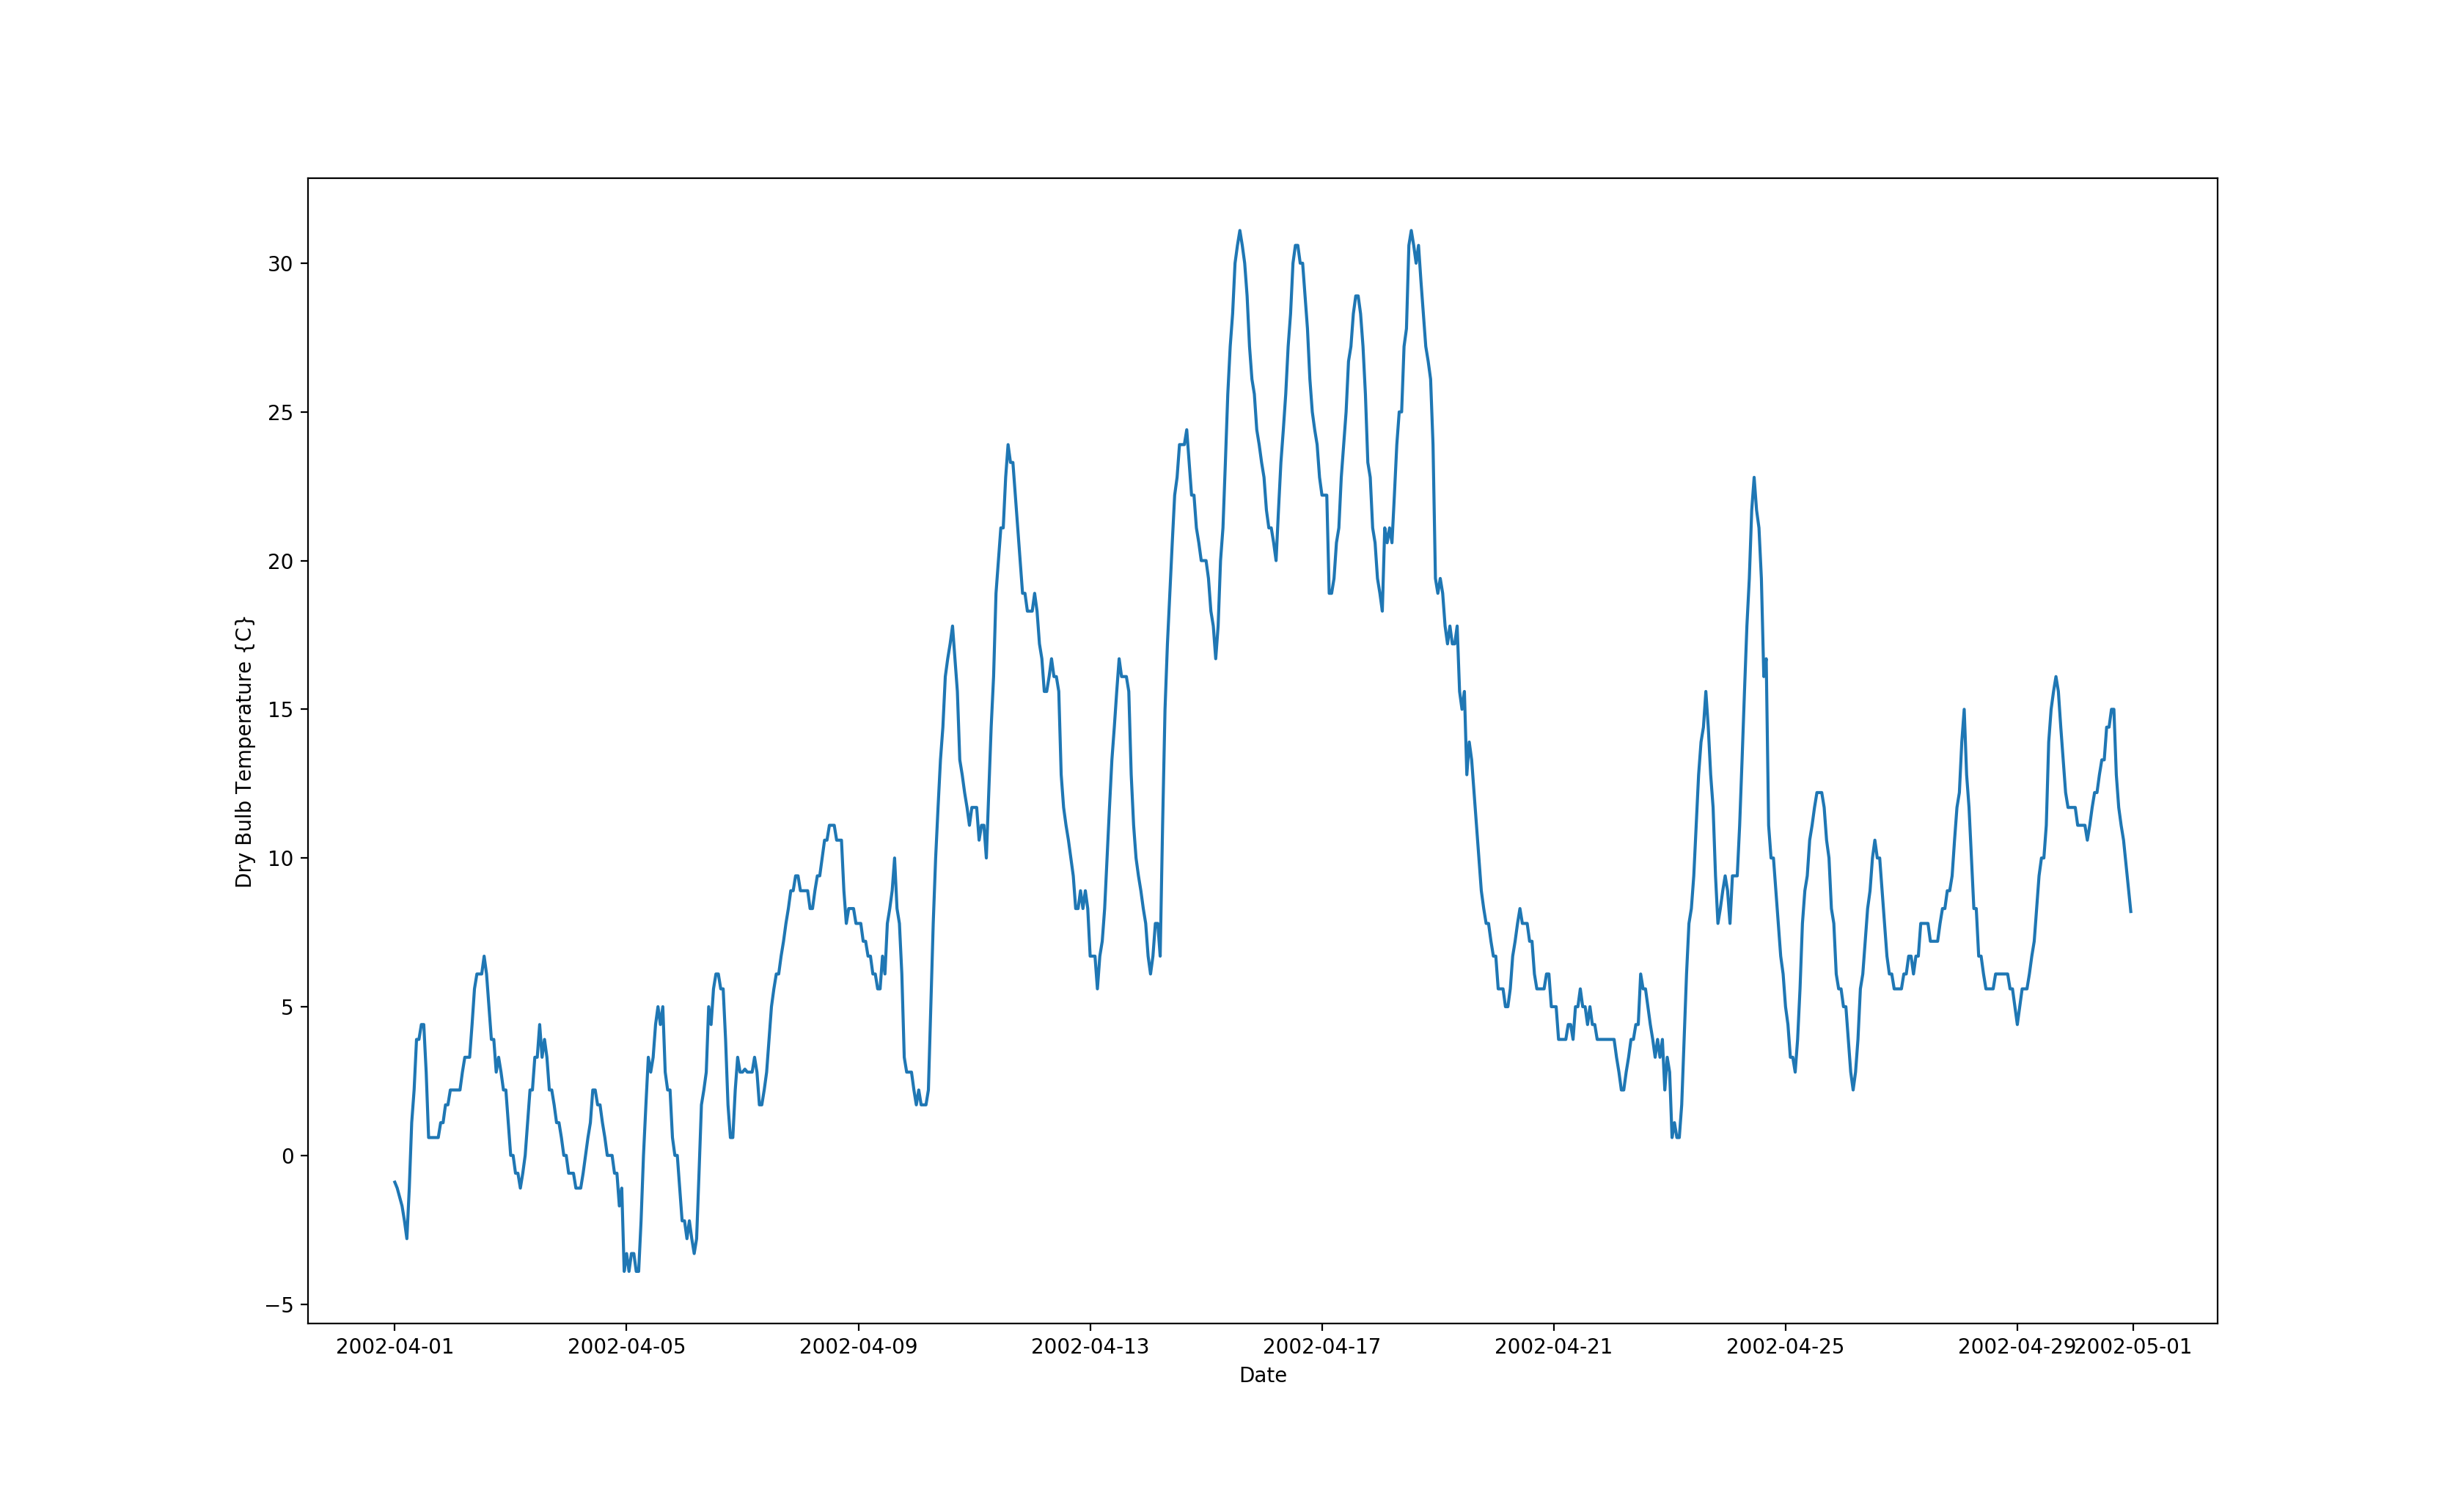
However, when I run a simulation and output the weather variables via EMS, I do see nonzero weather data. Does E+ do some magic behind the scenes to calculate the missing data?

Thanks.

edit retag flag offensive close merge delete

2 Answers

Sort by ยป oldest newest most voted
4

answered 2020-03-15 17:59:01 -0500

There's probably not any missing data. That warning happens because OpenStudio is trying to figure out if the EPW that has been provided is "actual" or "typical" data. The process to generate TMY (typical meteorological year) data stitches together data in month-long chunks from different years. An easy check is to look at each data point in the EPW and check if it has a full date that is consecutive with the data points around it, the EPW header tells us how many data points to expect. If everything is consecutive, then the EPW is most likely actual. Unfortunately, even that isn't foolproof. I've seen actual weather data from a leap year that leaves out the leap day. Oops.

If you open the EPW in a spreadsheet program I'll bet you find that it has 8760 hours of data (with some data in a header at the top). The EPW format is described in the Auxiliary Programs document.

edit flag offensive delete link more

Comments

1

An alternative to opening the EPW in a spreadsheet program (which requires changing the .epw file ending), you can load the EPW directly into Elements and use it's graphing capabilities to analyze the weather data.

Aaron Boranian's avatar Aaron Boranian  ( 2020-03-16 10:29:11 -0500 )edit

Thanks for the detailed response Jason. Sure enough, I saw 8760 hours of data. And stitching them together into a single year shows a clearer picture.

Thanks Aaron. I will check out Elements. I just used Python's matplotlib to visualize an EPW file read into a Pandas dataframe.

tenna031's avatar tenna031  ( 2020-03-16 10:52:16 -0500 )edit

You're welcome. Matplotlib might get hung up on the date-time of "typical" EPW files with different years, but it looks like you've figured out a way to address that in your answer post. Elements can read in "typical" or "actual" EPW files and plot the data just fine either way.

Aaron Boranian's avatar Aaron Boranian  ( 2020-03-16 11:41:12 -0500 )edit
0

answered 2020-03-16 10:53:40 -0500

tenna031's avatar

As @Jason DeGraw mentioned, E+ stitches together chunks of month-long data:

image description

edit flag offensive delete link more

Your Answer

Please start posting anonymously - your entry will be published after you log in or create a new account.

Add Answer

Careers

Question Tools

1 follower

Stats

Asked: 2020-03-15 13:03:36 -0500

Seen: 361 times

Last updated: Mar 16 '20