Ideal loads - zone cooling load decreases with increase in OAT

I am running an ASHRAE 90.1 prototype MediumOffice building converted into an Ideal Air Loads (IAL) model and I am trying to understand what the output variables of the IAL object represent, specifically, the Zone Ideal Loads (ZIL) Zone Total Cooling Energy (TCE)
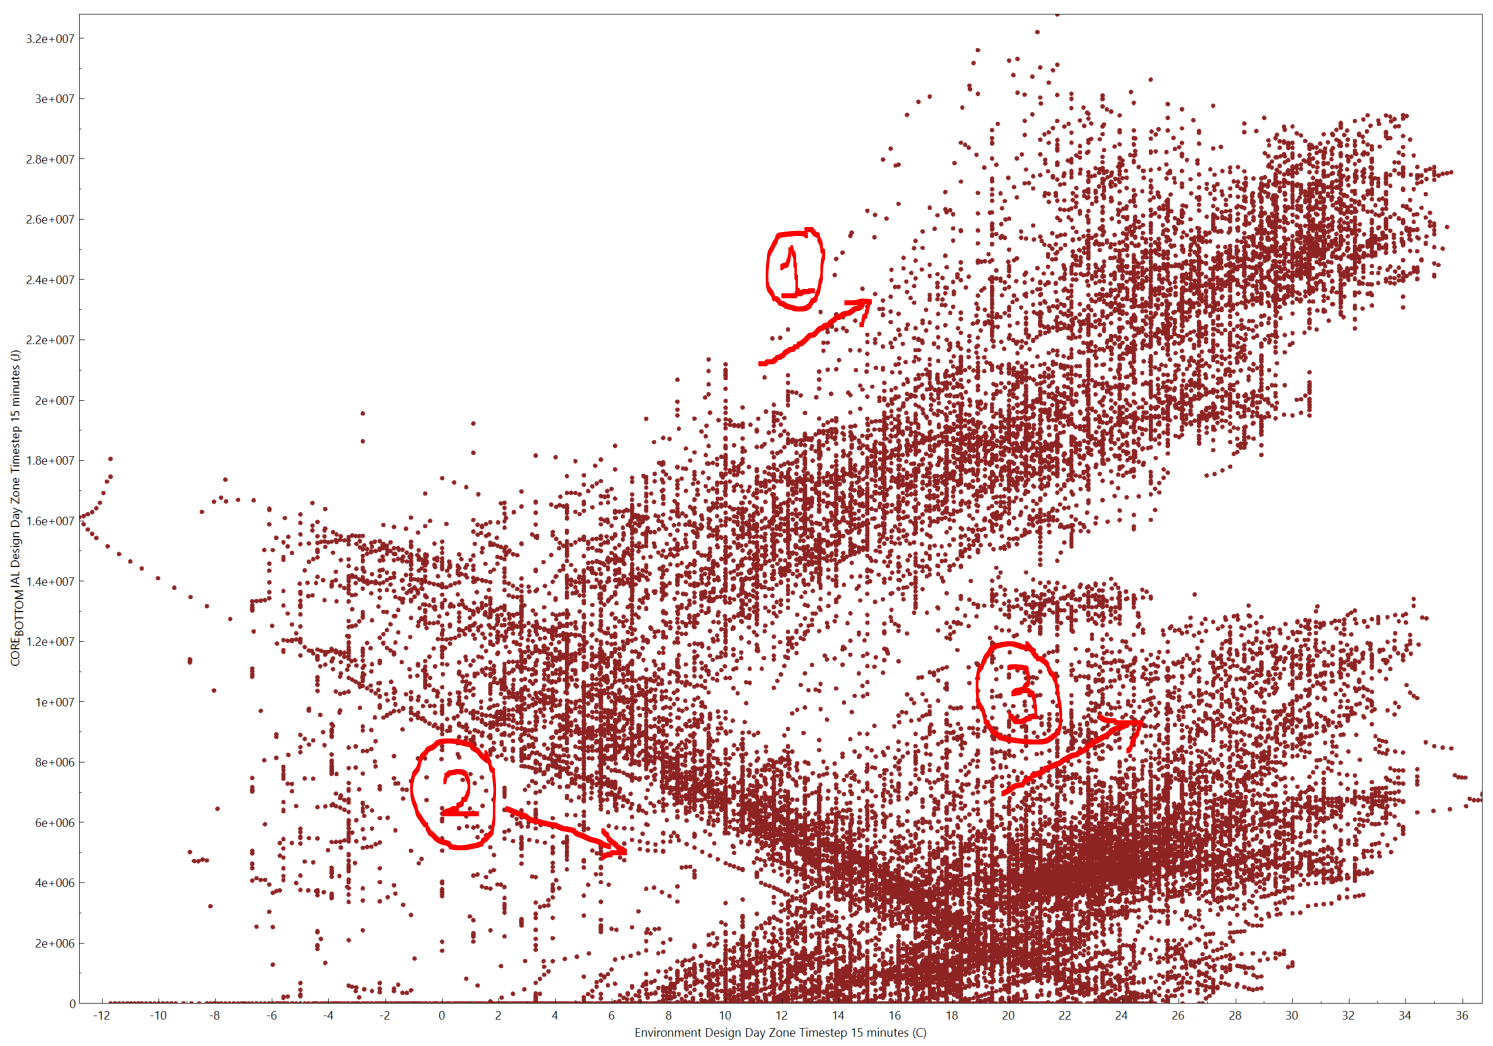
Following is the plot of ZIL Zone TCE against Outdoor Air Temperatures for the core bottom zone. The zone has the usual office internal gains, no infiltration and a scheduled ventilation load (off during unoccupied night hours and Sundays).
I am trying to understand the odd downward trend (2) in the graph where the zone loads decrease with increase in OAT. Trend (1) is mostly seen during occupied hours and (3) mainly during unoccupied hours. However, (2) appears in both the plots.
From one of the answers here, the missing part in the ideal loads equation is the free cooling. Can someone elaborate on what that is, how does EnergyPlus calculate it and does it have anything to do with trend(2).
