Question-and-Answer Resource for the Building Energy Modeling Community
Get started with the Help page
Ask Your Question
1

Why the peak cooling and heating load are always on July 21th or Jan 21

asked 2019-01-24 14:28:59 -0500

desie's avatar

Hello,

I am wondering if anybody knows how to determine the peak cooling and heating load from the simulation? For some reasons, no matter what I change the zone conditions, the peak cooling is always on July 21th and peak heating on Jan 21th. I read these numbers from HAVC Sizing Summary, For: Entire Facility, under the section of Zone Sensible Cooling and Zone Sensible Heating

Since I a new user I cannot attach any file. However, I uploaded the associated files on Google drive, and the link is below:

https://drive.google.com/drive/folder...

Thank you for help!

edit retag flag offensive close merge delete

1 Answer

Sort by ยป oldest newest most voted
4

answered 2019-01-24 15:18:45 -0500

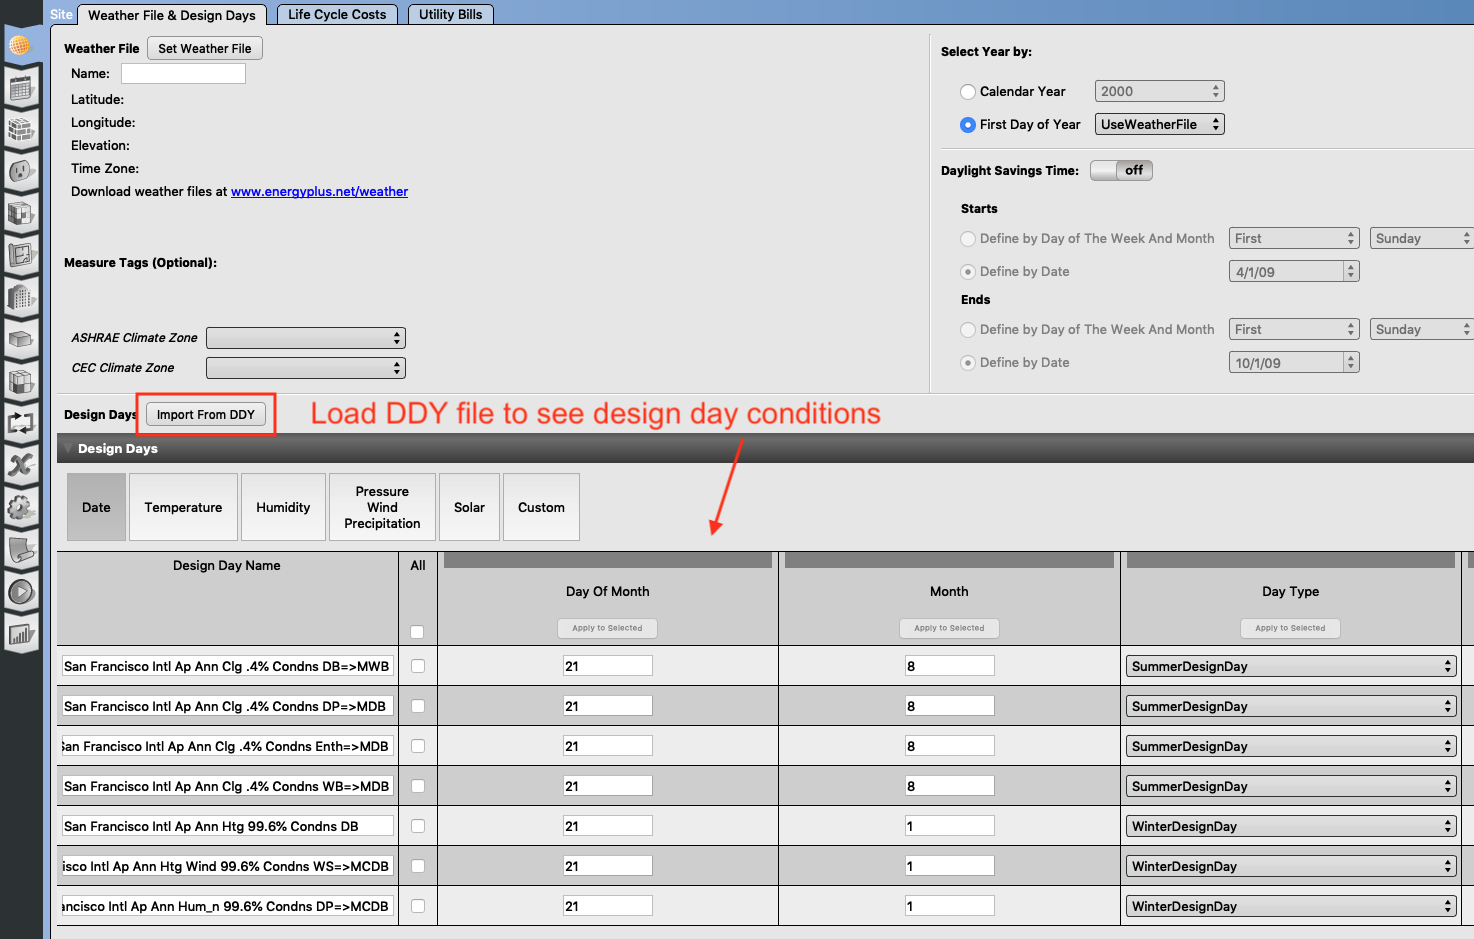
OpenStudio can simulate both an annual simulation as well as a HVAC design day simulation. The results of the HVAC design day (peak cooling / heating loads, equipment capacity, etc.) are shown in the HVAC Sizing Summary that you mentioned. In OpenStudio, you specify the weather data for HVAC design day simulations in a *.ddy file in the first Site tab at the top of the buttons on the left (see screen shot below).

image description

These HVAC design day weather conditions for summer and winter are usually specified by ASHRAE to occur on a specific calendar day for a given location. It sounds like all of your summer design conditions are set on July 21, and all winter design conditions are set on Jan 21. In my screen shot above, summer design conditions are on Aug 21. I should note that the peak loads you see in the HVAC Sizing Summary will be for the design day condition that calculates the greatest capacity.

For more background on HVAC design days vs. annual simulations in EnergyPlus and OpenStudio, there are lots of posts on Unmet Hours (like here and here and here).

edit flag offensive delete link more

Comments

1

So if I understand correctly, the peak capacity is shown in HVAC Sizing Summary is showing the maximum capacity of the HVAC system for the worst conditions.

May I know where should I look at for the peak cooling and heating load for the entire year for the average conditions (average condition in EPW file)?

Thank you

desie's avatar desie  ( 2019-01-25 10:33:34 -0500 )edit
2

Correct - peak capacity in HVAC Sizing Summary is showing max capacity over just the 24-hour winter and summer design days. If you want to see peak cooling and heating load from the annual simulation, you review the Sensible Heat Gain Summary. It has tables for contributors to cooling and heating loads, expressed as either annual total energy or peak energy rate (and when they occurred during the annual simulation) for each zone and the whole building.

Aaron Boranian's avatar Aaron Boranian  ( 2019-01-25 17:02:41 -0500 )edit

Your Answer

Please start posting anonymously - your entry will be published after you log in or create a new account.

Add Answer

Training Workshops

Careers

Question Tools

2 followers

Stats

Asked: 2019-01-24 14:28:59 -0500

Seen: 307 times

Last updated: Jan 24 '19