Question-and-Answer Resource for the Building Energy Modeling Community
Get started with the Help page
Ask Your Question
3

Adjacent zones (similar constructions) have differing thermal loads

asked 2018-11-21 13:32:58 -0600

updated 2018-11-21 15:33:36 -0600

I have a zone in my building (named "MAIN/UPPER EAST") that has a very large load compared to other areas of similar size and constructions. I've combed through all of the surfaces and I'm sure everything is correct. Below is an example of what the space looks like, I've included some areas around it that reflect other spaces. All of the constructions are the same.
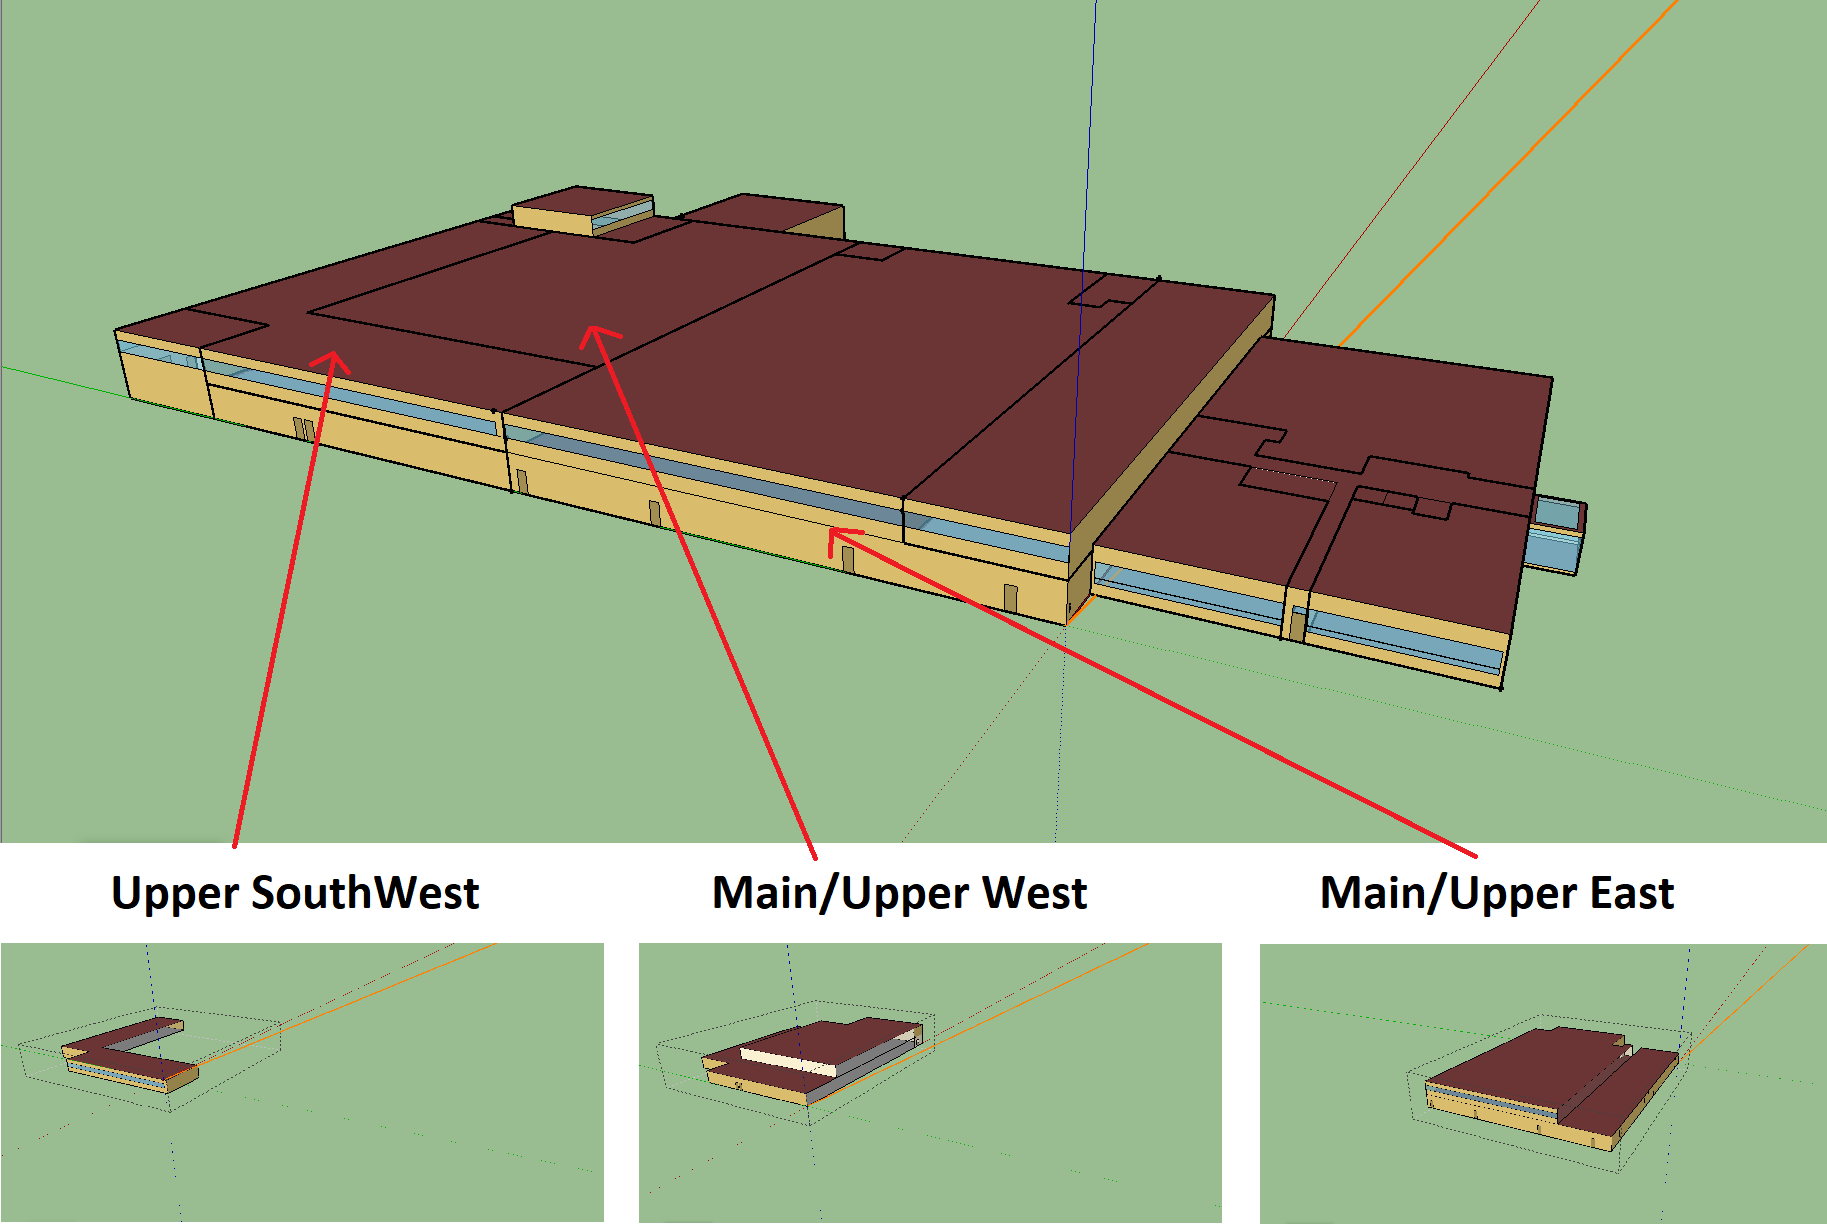
image description

Below is a table of some general characteristics of the described spaces: image description

OSM model: https://drive.google.com/open?id=1NjR...

At first glance, does this look normal? I think this load is very high, I just can't seem to find out why.

edit retag flag offensive close merge delete

1 Answer

Sort by ยป oldest newest most voted
1

answered 2018-11-23 04:11:56 -0600

You have more than twice the lighting power in the west compared to the east zones:

  • Main Upper West: Storage Upper + New Emerg Lighting ~= 22kW
  • Main/Upper East: Storage Main Floor ~= 10 kW

And both of these use the same fractional schedule, which doesn't have a "Summer/Winter Design day Profile" to it uses the default run period profile for sizing days (for lighting people often set lighting to 0 for winter design day and 1 for summer design day in order to size for the worst case conditions)

Also, I would suggest you double check the boundary conditions of the surfaces in your model, from the picture the West zone should have a lot less exterior wall area than the East zone, but the table you pasted said otherwise (I don't have Sketchup handy to check that). That's going to make the east zone have more heating load though.

edit flag offensive delete link more

Comments

@Julien Marrec I did not include a summer/winter schedule because there is no difference between them and there is no colling in these air loops. Most of the lighting is controlled (not within the model, but in the actual building) by proximity sensors, the schedule is estimated based on site visits and staff information. Both these lighting loads I've placed at 0.25 scale (daily avg) of the load, distributed with a midday peak. Either way, the difference in lighting load is (12kW * 0.25) 3000 W, that's 0.76% of the load of the "...East" zone.

re-measure's avatar re-measure  ( 2018-11-25 20:21:47 -0600 )edit
1

@Julien Marrec regarding your last point on the boundary conditions, I do agree that the West area should have less exterior wall area. I've already double checked the boundary conditions, I'll have to have a third look at it. This however still doesn't account for why the "EAST" zone has a greater load.

I still need to re-run this model with AMY, and compare to actual energy usage for the same period. I'm hoping that once I do so, the loads may end up making sense.

re-measure's avatar re-measure  ( 2018-11-25 20:23:52 -0600 )edit

Your Answer

Please start posting anonymously - your entry will be published after you log in or create a new account.

Add Answer

Training Workshops

Careers

Question Tools

2 followers

Stats

Asked: 2018-11-21 13:32:58 -0600

Seen: 176 times

Last updated: Nov 23 '18