Question-and-Answer Resource for the Building Energy Modeling Community
Get started with the Help page
Ask Your Question
0

Why is EnergyPlus only reporting peak heating load?

asked 2018-11-21 10:45:49 -0500

updated 2018-11-30 15:52:38 -0500

It seems that in the results table, EnergyPlus only defaults to outputting information for the heating design day or peak heating day. Why isn't it reporting information for July 21st as well as January 21st/is this something I can rectify?

In this case I'm running just for sizing days and am using Ideal Air Loads.

image descriptionimage description

edit retag flag offensive close merge delete

Comments

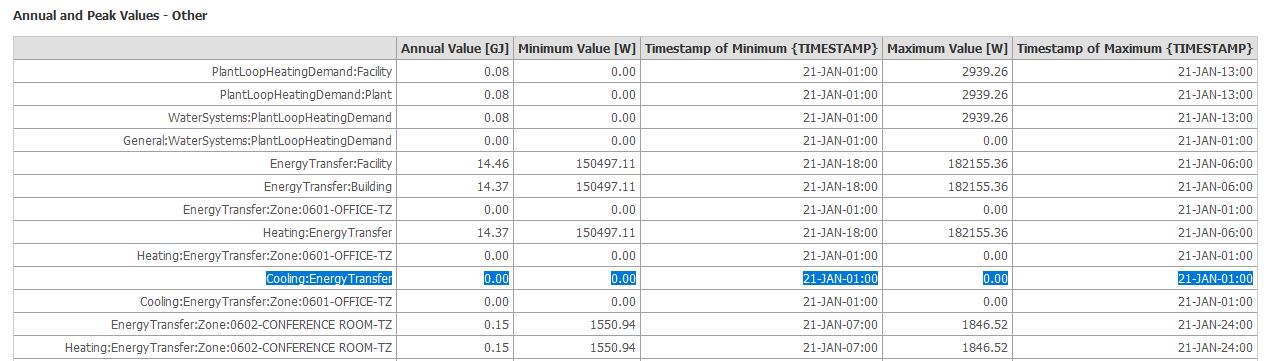
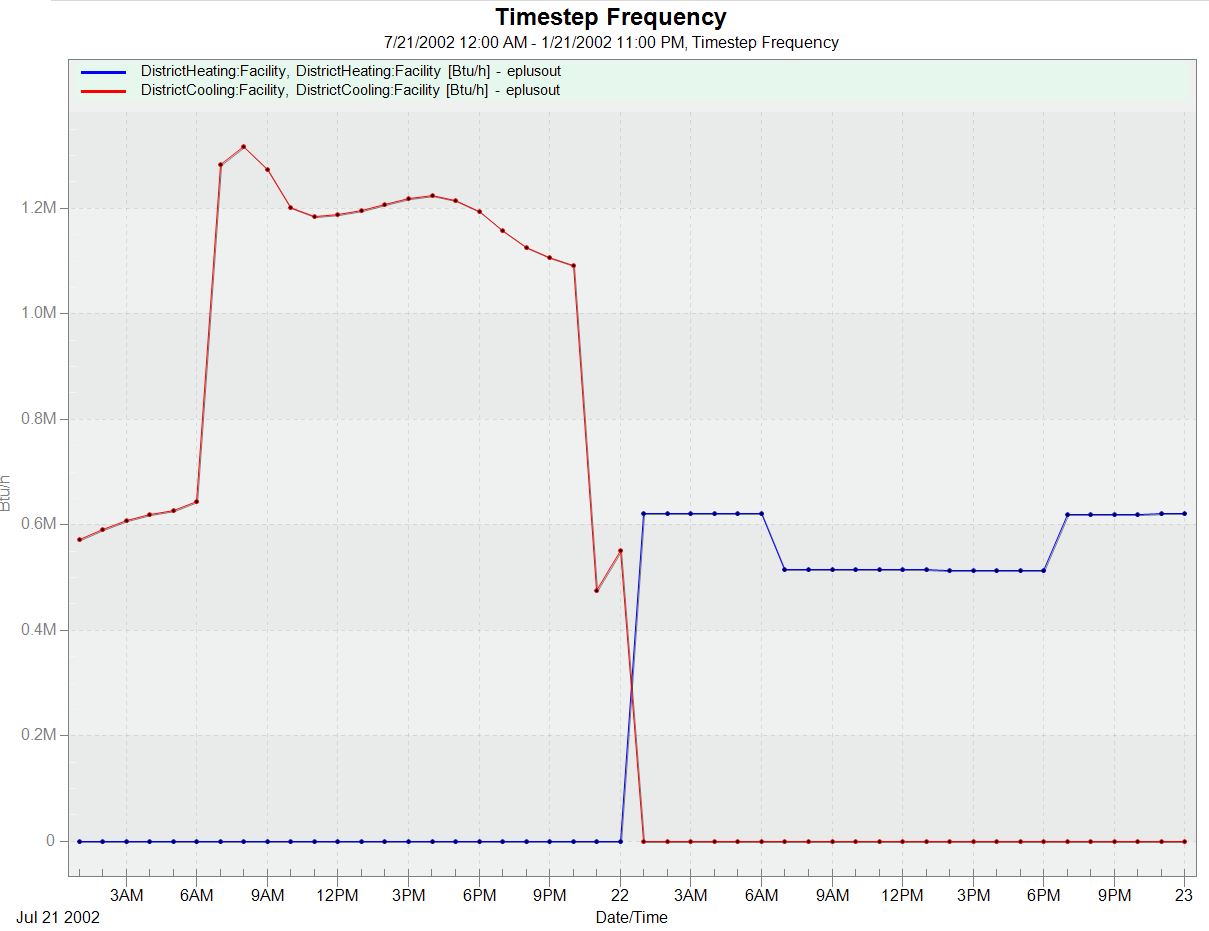
As an update: When I request that the simulation just run for the cooling design day, the values for peak cooling energy transfer are reported. And the value for Cooling:DistrictCooling matches the value shown in the plot that I have posted (above) from my original run.

So, this is definitely not an issue of there being no cooling load, it is simply a reporting issue that seems to exclude cooling design day peaks in favor of heating design day peaks for some reason. It'd be great to find a way around this - though doing separate runs for heating and cooling isn't the worst thing...

jbatt's avatar jbatt  ( 2018-11-30 15:52:23 -0500 )edit

2 Answers

Sort by ยป oldest newest most voted
6

answered 2018-11-21 17:21:34 -0500

It looks to me as if you had no cooling energy transfer and the reported time is the first time step simulated. I would not expect the program to report July 21 if there was no cooling, since there was also no cooling Jan and this month was simulated first (I'm guessing). Then for July, 0 is not greater than 0, so the time stamp did not get updated. You could try switching the order of your design days and see if July 21 shows up in the table. But it's still 0 so what does the time stamp really mean?

edit flag offensive delete link more

Comments

Thanks @rraustad. I've attached an output (from the same run). Again, this was just run for my heating and cooling design days. If I'm understanding your response correctly - based on this output, I should expect to see cooling energy usage/demand for July 21 in the table I had originally uploaded. Correct?

Is there some other reason that only the first timestep is making it into that results table?

jbatt's avatar jbatt  ( 2018-11-26 13:51:55 -0500 )edit

If the cooling energy transfer is really 0, then it should still be 0. From your plot it looks to be greater than 0. Look in the mtd file and search for "Cooling:EnergyTransfer" to see what this meter represents. Then look to those meters to see why the output is 0 (or if not send me your input file).

rraustad's avatar rraustad  ( 2018-11-27 07:32:18 -0500 )edit

According to the mtd file, "Cooling[Heating]:EnergyTransfer" represents the sum of the "Zone Air System Sensible Cooling[Heating]Energy" for all zones. I'm not exactly sure of how to get from here to determining why the output is 0 though. What is best why to send you an idf? On a possibly unrelated note, if you look at the table I had added, it seems that the results from my first zone (0601) got mixed in with these last two whole-building meters. When I look at the structure of the mtd file, it makes sense that this is happening but I'm confused as to why it would be structured this way

jbatt's avatar jbatt  ( 2018-11-29 10:42:37 -0500 )edit

You would add Output:Variable,*,Zone Air System Sensible Cooling Energy,Hourly; and heating to your input file and then look at those results after the simulation. Click on my user name for my email.

rraustad's avatar rraustad  ( 2018-11-29 12:05:51 -0500 )edit

Requesting these outputs didn't seem to offer any clarity (I think I was actually getting these by default). I've sent you my files and commented with an update above. Thanks for all of your help so far.

jbatt's avatar jbatt  ( 2018-11-30 15:57:11 -0500 )edit
4

answered 2018-11-21 14:18:40 -0500

Peak only happens once, either on the Heating Design Day or the Cooling Design day. It seems like you are not cooling the Space in the screenshot you sent. You can try looking at that variable in Dview.

edit flag offensive delete link more

Comments

That seems illogical to me. "Peak" can only occur on one of the two days (heating or cooling), but can occur during any hour of that day? You would think it would report the highest value recorded over the simulation, for each variable, and then apply the appropriate timestamp for both the day and hour.

jbatt's avatar jbatt  ( 2018-11-21 15:09:48 -0500 )edit

Thanks for the downvote. It's expected that peak cooling happens during the summer design day and peak heating during the winter design day.

As it was pointed in the other answer, it seems like you don't have a cooling load therefore the "peak cooling" happens at the first timestep. It will not report anything on July 21 because nothing is happening. A load is not the same as a gain. Go check your thermostat settings.

Luis Lara's avatar Luis Lara  ( 2018-11-21 21:15:49 -0500 )edit

Your Answer

Please start posting anonymously - your entry will be published after you log in or create a new account.

Add Answer

Careers

Question Tools

2 followers

Stats

Asked: 2018-11-21 10:45:49 -0500

Seen: 562 times

Last updated: Nov 30 '18