Question-and-Answer Resource for the Building Energy Modeling Community
Get started with the Help page
Ask Your Question
3

Chiller COP calculation wrong

asked 2018-10-22 05:33:59 -0500

HJOJOA's avatar

updated 2018-10-22 08:02:58 -0500

Hi,

I have created vfd compressor Electric chiller using manufacturer data for typical office building application, but when running the simulation i notice the electric consumption is not what i spec.

Rated conditions is: 7C Leaving water temp, 0.0246 M3/s water flowrate and 35C outdoor temp.

Data used for coefficient are:

Data at 7C leaving water and 35C outdoor temp

image description

Data at 0.0246 m3/s

image description

Using EP tools, coefficient can be calculated, the problem is the COP in the simulation should increase when temperature and capacity decrease but the simulation show opposite.

image description

Outdoor temp red, COP green, electrical consumption blue.

Maybe i'm choosing data for coefficient calculation wrong, can somebody give to me some advice's , whats i'm doing wrong?

edit retag flag offensive close merge delete

1 Answer

Sort by ยป oldest newest most voted
3

answered 2018-10-22 09:16:50 -0500

updated 2018-10-25 13:22:50 -0500

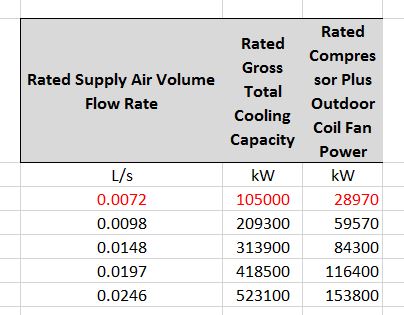
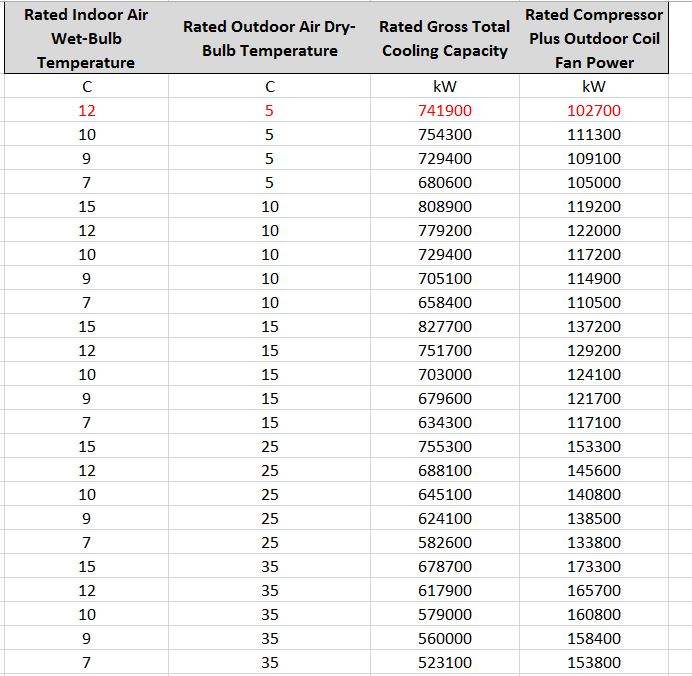
Since you mention Leaving water temperature, I assume you are using Chiller:Electric:ReformulatedEIR. There are 3 curves, Cooling Capacity Function of Temperature Curve Name and Electric Input to Cooling Output Ratio Function of Temperature Curve Name are both a function of leaving chilled and condenser fluid temperatures. Your 2nd table shows this data. The final curve is Electric Input to Cooling Output Ratio Function of Part Load Ratio Curve Name which is a function of part-load ratio. I think you meant to create this curve using your first table. However, I see what looks like a flow rate instead of part-load ratio which would be numbers between 0 and 1. You should also plot your curves using a spreadsheet. For example plot Cooling Capacity Function of Temperature Curve result versus leaving condenser water temperature for discrete leaving chilled water temperatures (plot data only for 7C, then other data for 9 C, etc.). This way you can see how the curve behaves at different temperatures. Also do this for the Electric Input to Cooling Output Ratio Function of Temperature Curve.

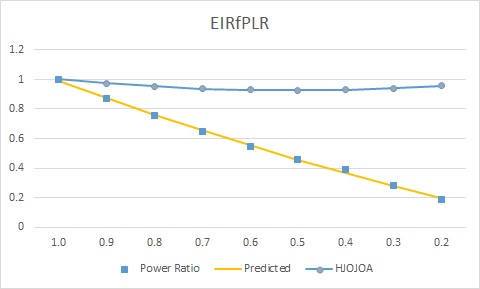
I plotted your EIRfPLR curve and it doesn't look right. This curve should go to 0 as PLR goes to 0. This means you are getting full power at low part-load conditions and would explain the low COP numbers. The EIRFPLR curve is really a power ratio curve. Compare the power ratio at each PLR or if power is 28.97 kW at PLR = 0.2 and power is 153.8 kW at PLR = 1 then at PLR = 0.2 the power ratio is

Power ratio = 28.97 kw / 153.8 kW = 0.18836.

Creating regression coefficient in Excel is easy once you know how to do it. The document I provided shows exactly how to do that and I'm sure you can find lots of information on the web.

Your curve coefficients:

Curve:Quadratic,
  ChlrAirScrollEIRRatio_fQRatio,          !- Name
  1.0069198702,                           !- Coefficient1 Constant
  -0.3099076705,                          !- Coefficient2 x
  0.3029878003,                           !- Coefficient3 x**2

My curve coefficients:

Curve:Quadratic,
  ChlrAirScrollEIRRatio_fQRatio,          !- Name
  0.053494024,                            !- Coefficient1 Constant
  0.672923035,                            !- Coefficient2 x
  0.266558864,                            !- Coefficient3 x**2

image description

Here is the power equation directly from the code.

Power = (AvailChillerCap / ReferenceCOP) * ChillerEIRFPLR * ChillerEIRFT * FRAC;

where:

AvailChillerCap is the full load output at current operating condition of Tevapin and Tout

ReferenceCOP is the rated COP

ChillerEIRfPLR is the curve discussed here

ChillerEIRFT is the EIR as a function of temperatures

and FRAC is when the chiller cycles below min PLR, above min PLR then FRAC = 1

edit flag offensive delete link more

Comments

That mean i'm entering in wrong way the data in the curvfittool to generate the "Electric Input to Cooling Output Ratio Function of Part Load Ratio" coefficients, can you share with me some pictures about how to write in correct way the data in the curvfittool for coefficients (temperaure and partload), because is not so clear for chillers.

HJOJOA's avatar HJOJOA  ( 2018-10-22 10:55:12 -0500 )edit

I think all you need to do is change the water flow rates in the first table to part-load ratios (0-1). The last one, column 1, row 6 in table 1, will be 1.0. The fourth, next to last, is 418,500 / 523,100 = 0.8. The third is 0.6, etc. Then the EIRFFF will be your EIR as a function of part-load ratio curve. So the 1st column should be 0.2, 0.4, 0.6, 0.8 and 1.0.

rraustad's avatar rraustad  ( 2018-10-22 12:16:50 -0500 )edit

Ok, thank you for your help, for clarification, can you check if it is the right way to writhe in the curvefittool:

  • For CAPFT and EIRFT, in the fist column Chiller leaving water temp, second is outdoor temp, third is gross capacity and fourth is electric power.

    • For EIRFPLR, In the first column partial load, second is gross capacity and third is electric power.

Please if i'm doing something wrong please inform to me. I want to share with you the XLS file https://we.tl/t-DEYTrzkrFc

Thanks

HJOJOA's avatar HJOJOA  ( 2018-10-22 14:12:24 -0500 )edit

You never told me which chiller model you were using. For CAPFT and EIRFT: if you are using Chiller:Electric:EIR then you are correct. If you are using Chiller:Electric:ReformulatedEIR then it's chilled water leaving temp, condenser water leaving temp, capacity and then power. For EIRfPLR that sounds correct for EIR model, but ReformulatedEIR seems to use chilled water leaving temp and PLR which means you can't use the curve fit tool. Have you read this document? It shows how curve fits are created using a spreadsheet.

rraustad's avatar rraustad  ( 2018-10-24 08:16:30 -0500 )edit

First, thank you to take the time to answer, the chiller is Electric EIR, but i have tried with other EP chiller and the result is the same, at very low partial load the chiller COP decrease below 2 while according manufacturer data and testing manually the chiller electric power the COP (with coefficients) this should increase. Maybe is another factor affecting the results, can i share with you my model? https://wetransfer.com/downloads/7968...

HJOJOA's avatar HJOJOA  ( 2018-10-24 19:54:44 -0500 )edit

Your Answer

Please start posting anonymously - your entry will be published after you log in or create a new account.

Add Answer

Careers

Question Tools

1 follower

Stats

Asked: 2018-10-22 05:33:59 -0500

Seen: 596 times

Last updated: Oct 25 '18