Something wrong with my HVAC --> Unreasonable heating consumption results


Hey everyone, I recently faced a problem that I tried to fix with some users, but I didn't provide them with enough informations which was confusing. So I am posting this question to explain my issue from the beginning.
I am modelling a residential building of 12 flats whose HVAC should be as follows: District heating for both water usage and floor heating + Heat recovery ventilaion
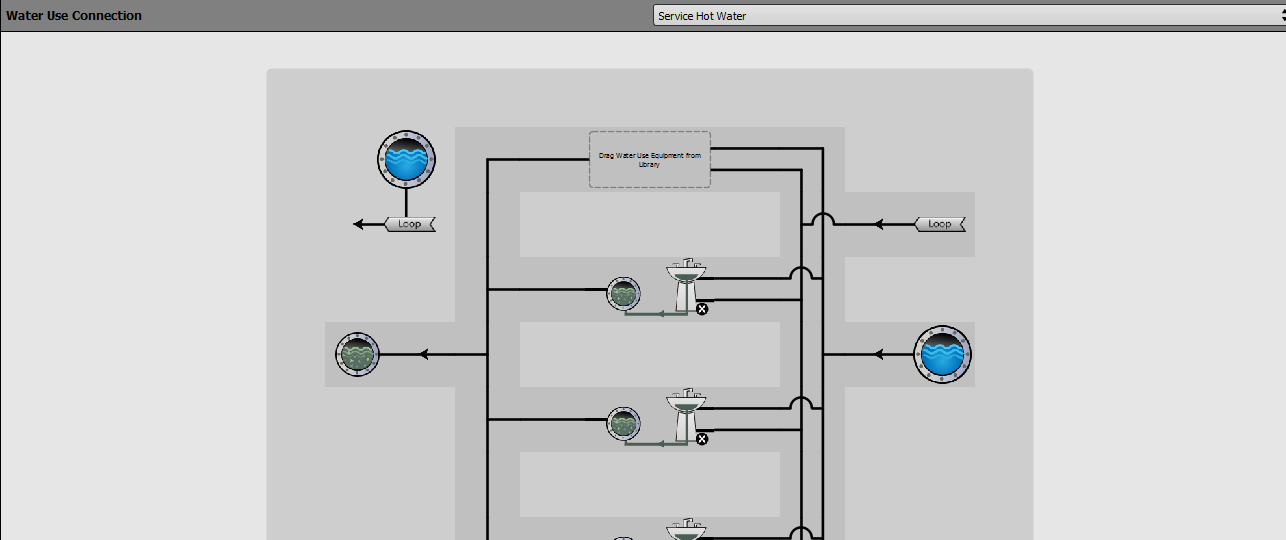
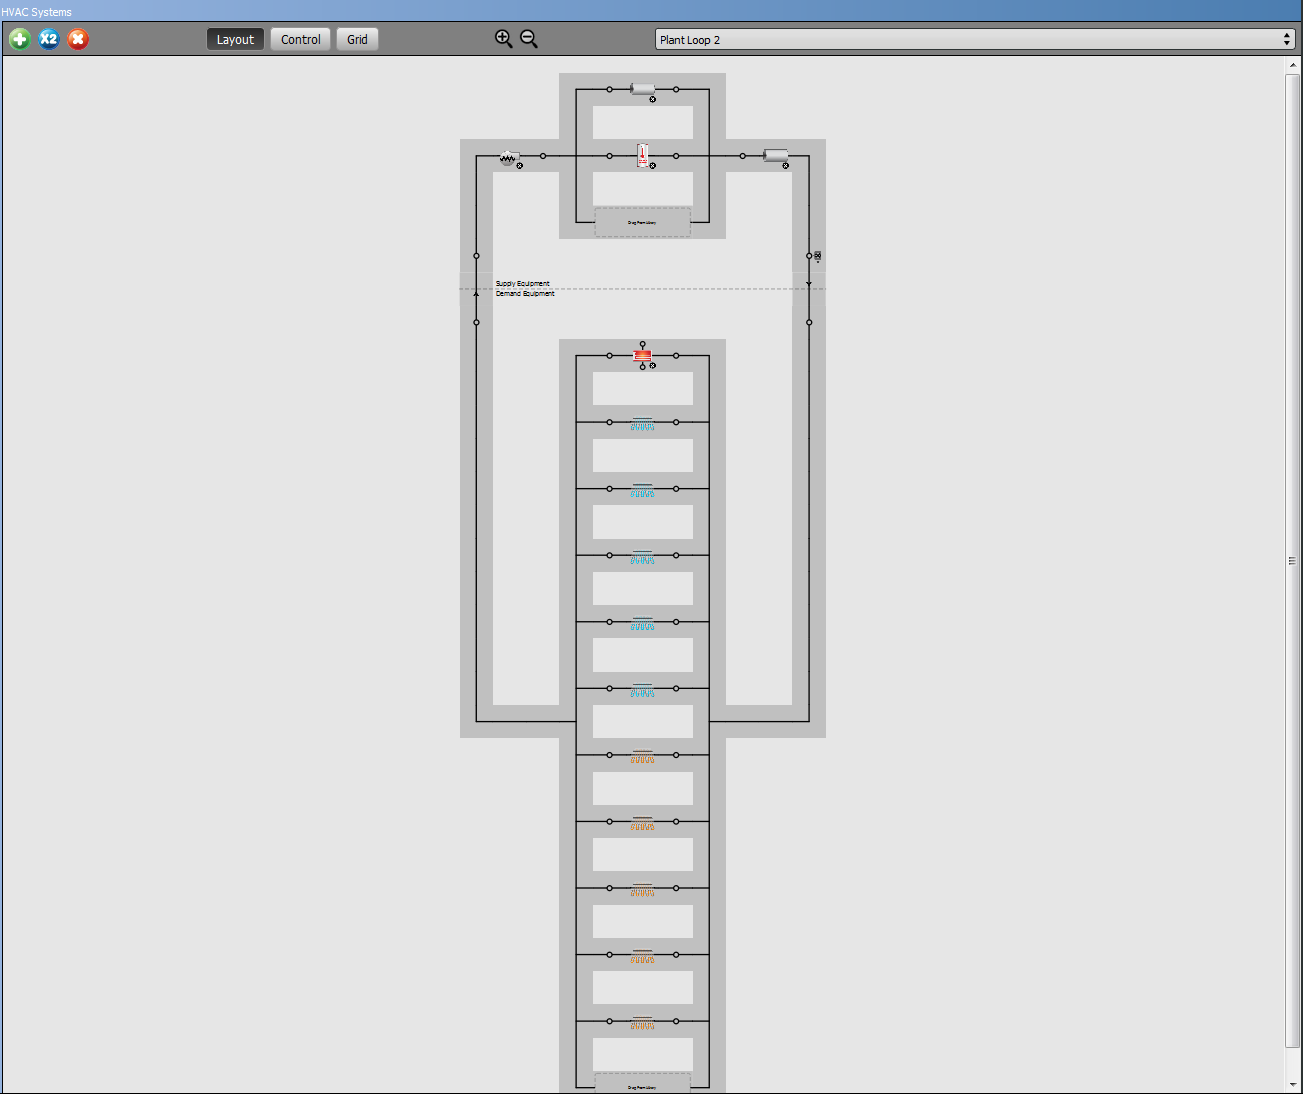
So these 3 screenshots show the hot water system configuration:
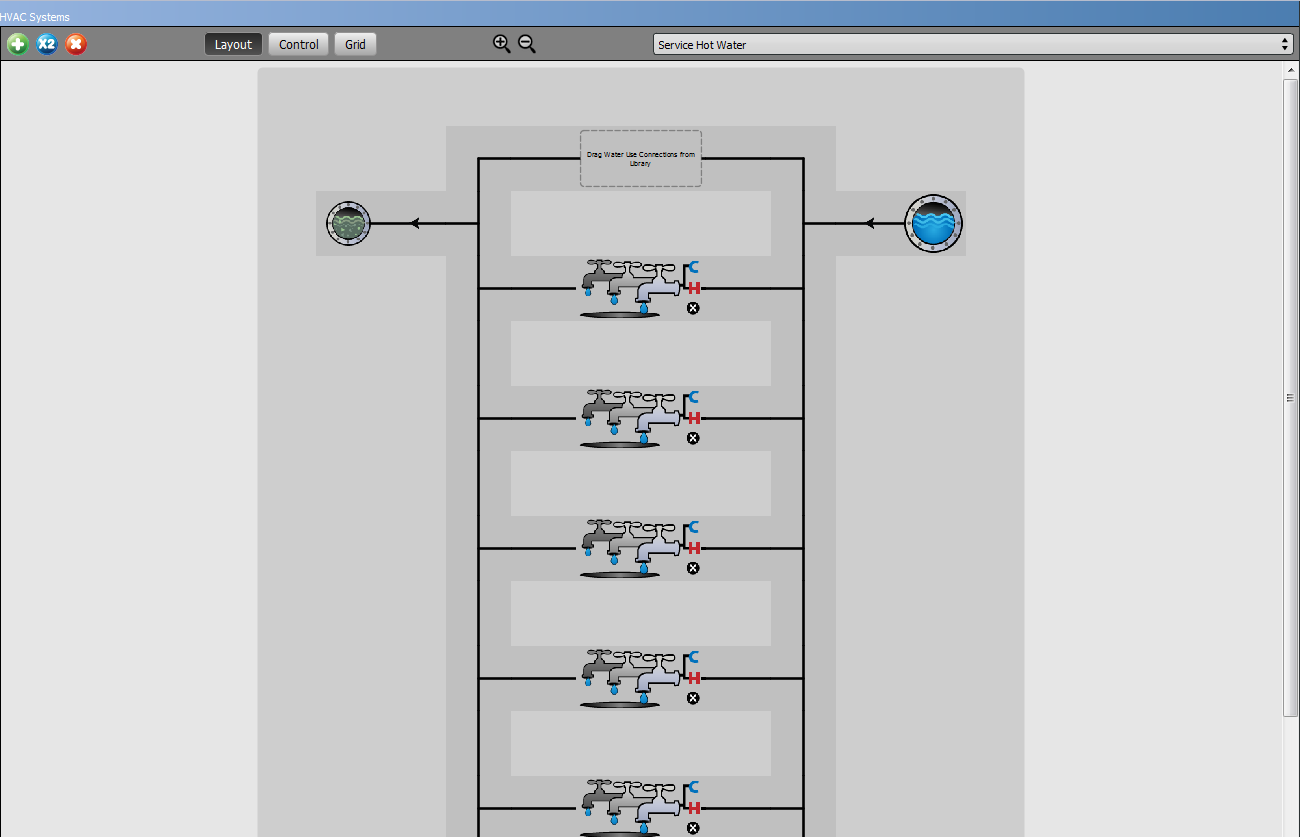
As you can see below it is a mixed water heater but the fuel type is District Heating as suggested by @egillmor (otherwise the ''DHW usage will show up as heating end use rather than water system end use.'')
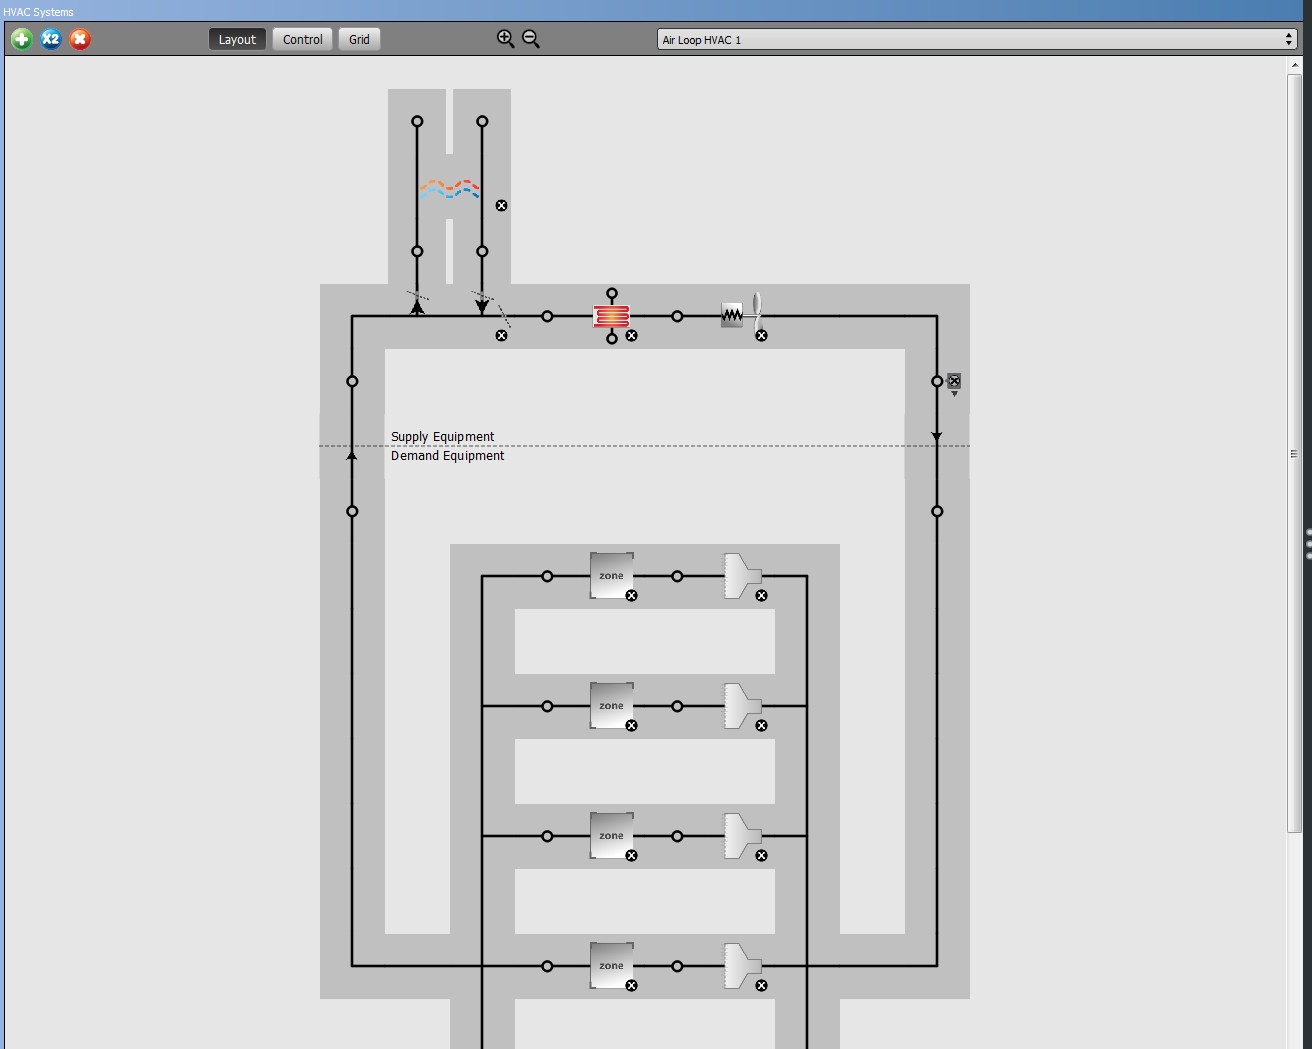
The rest of the screenshots will show the HR ventilation and radiant floor loop
Following the instructions of @MatthewSteen in this post I did this :
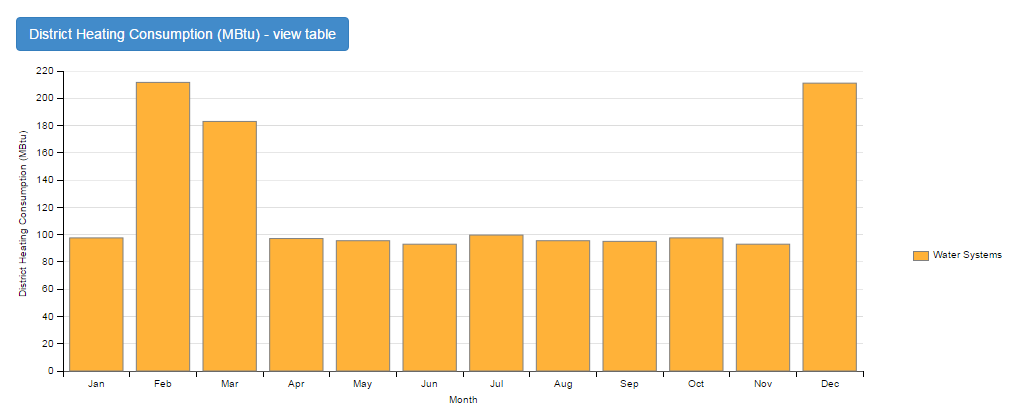
The simulation ran successfully, but the District heating consumption chart was illogical, as shown below: the consumption is more or less the same from April to November and it is also low in January, while it should be low fi the summer and gradually increasing during the winter.
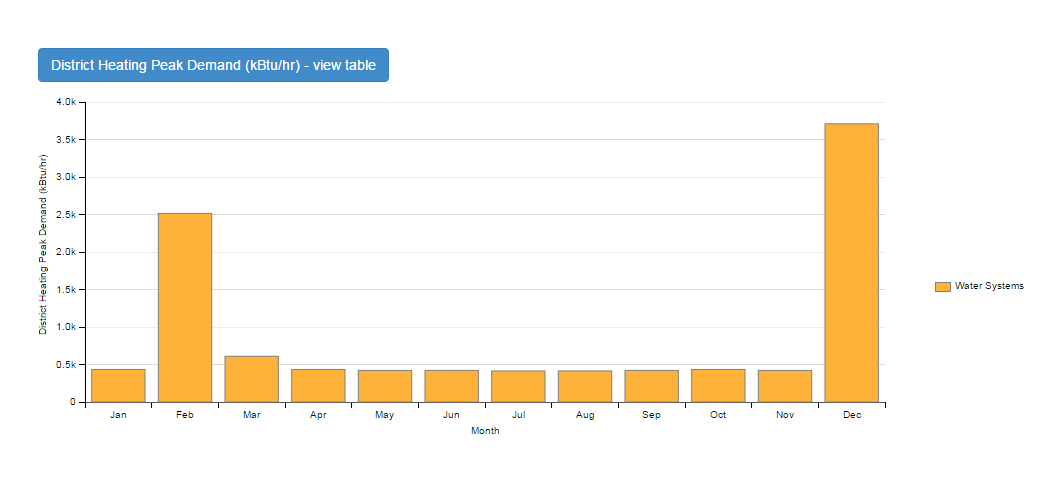
Same problem the the Demand
Does anyone have any idea about what is wrong with my HVAC that had led to that result ??
I hope I made it clear , but if there is any information missing, please let me know.
I would appreciate a lot your help ! :)
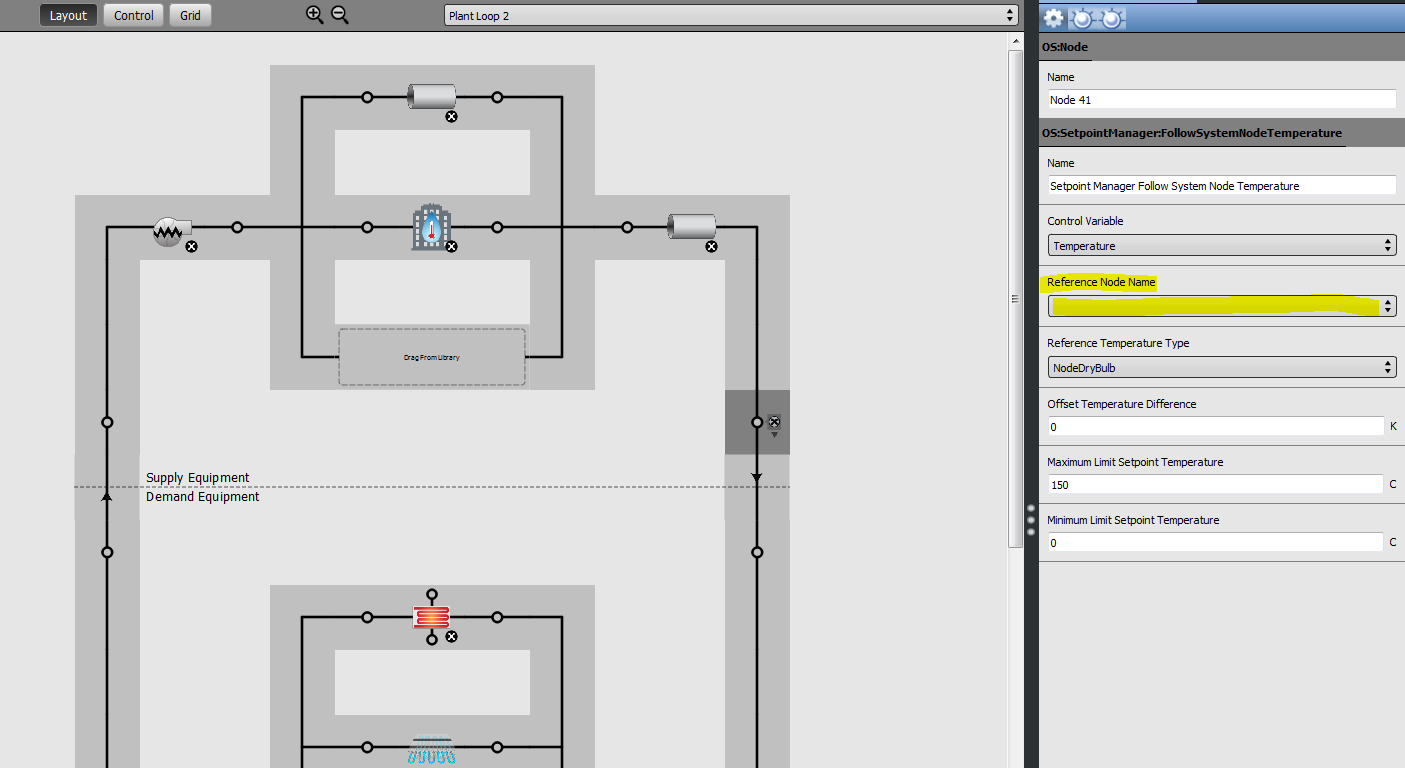 And that I set it as Node 41 later (like the name of the node) as simple as that.


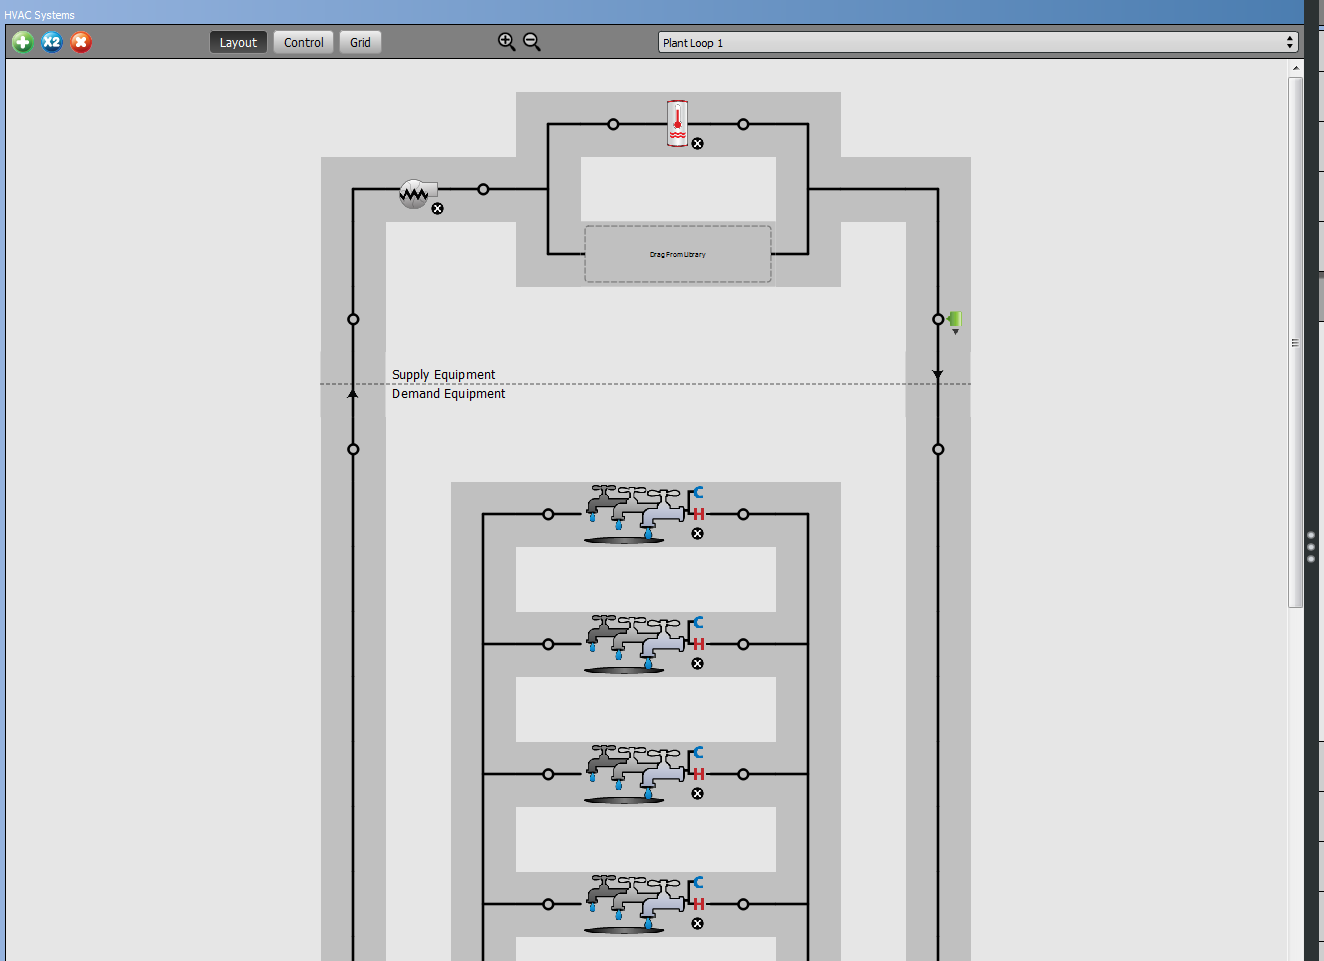
First thing is that you have a Water Heater object on your heating Hot Water loop, which is why all of your District Heating end uses show up as Water Systems. That one should be a District Heating object. Only use the Water Heater object for service hot water loops (like for potable water).
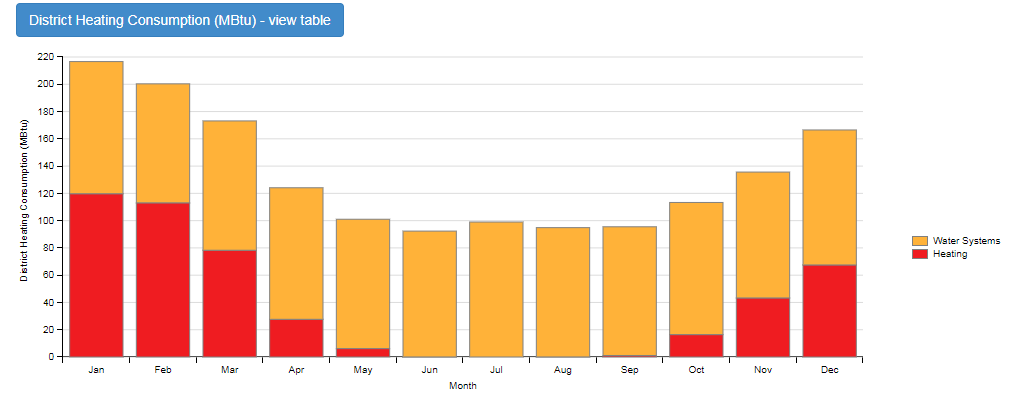
The "District Heating" chart you show above is just a fuel source -- You should have both Heating and Water Systems end uses in that chart, which show up as red and orange respectively.
@egillmor, i did that but I dont know it still only water systems and now the chart looks like that for the consumption and like this for the demand
I tried to change some parameters but it is still the same...
What type of Setpoint Manager do you have assigned to Plant Loop 2 and Air Loop HVAC 1?
@Eric Ringold
For Plant loop 2: Setpoint Manager Follow System Node Temperature, and for Air Loop HVAC: Setpoint Manager Follow Ground Temperature