Question-and-Answer Resource for the Building Energy Modeling Community
Get started with the Help page
Ask Your Question
1

analyse data viewer

asked 6 years ago

youssra's avatar

updated 6 years ago

I want to analyze the results obtained by data viewer but I saw that there is a contradiction between the end use graph and the results of dview, normally if I do the sum of annual consumption of heating and cooling, I must fell on the total consumption that is in end use graph but in dview the monthly consumption is very small as shows the figures belowimage description
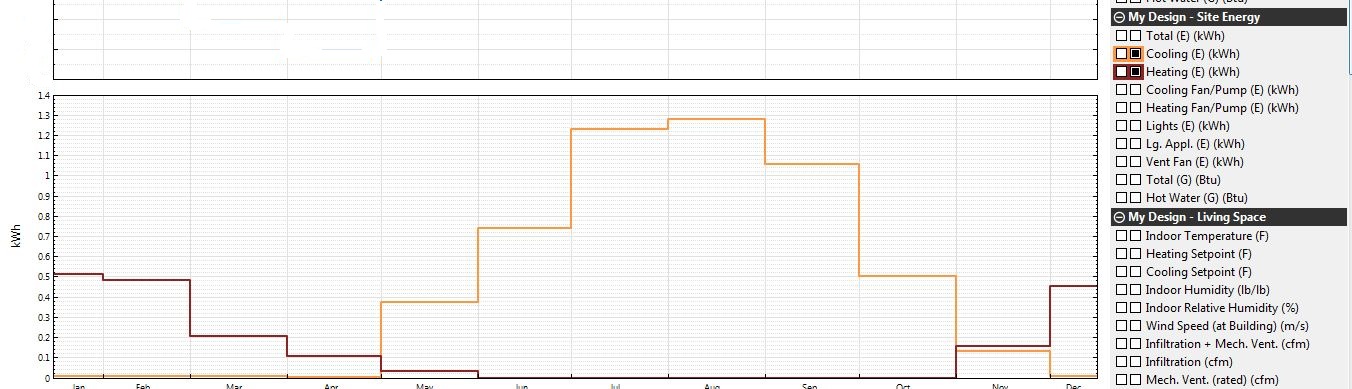
(/upfiles/15335549729494664.jpg)image description

Preview: (hide)

Comments

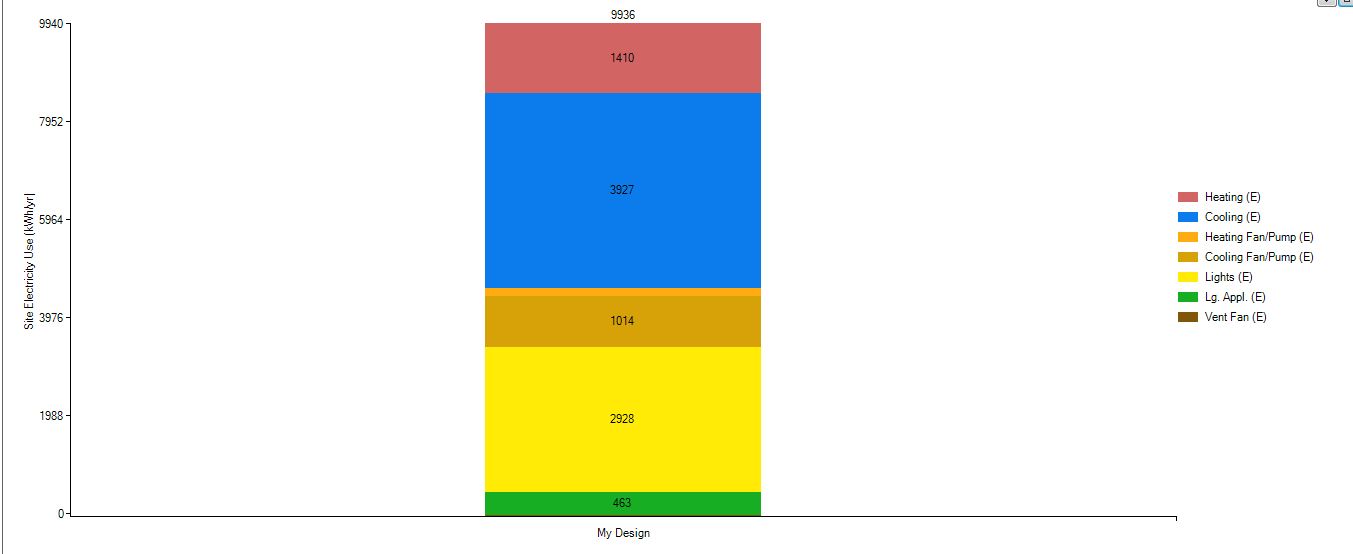
Your figures didn't come through.

shorowit's avatar shorowit  ( 6 years ago )

I had problems downloading the figures

youssra's avatar youssra  ( 6 years ago )

1 Answer

Sort by » oldest newest most voted
4

answered 6 years ago

The upper image is showing the average value that a variable takes over the month, not the sum. Those variables are reporting at the timestep or hourly level, so you're seeing the average timestep or hourly value for the month. If you want to see the totals by month, get the sum from the 'Statistics' tab and check the 'Show Monthly Values' checkbox.

Preview: (hide)
link

Your Answer

Please start posting anonymously - your entry will be published after you log in or create a new account.

Add Answer

Training Workshops

Careers

Question Tools

1 follower

Stats

Asked: 6 years ago

Seen: 259 times

Last updated: Aug 06 '18