Question-and-Answer Resource for the Building Energy Modeling Community
Get started with the Help page
Ask Your Question
1

PAT not calibrating Roof Insulation

asked 2018-07-27 01:59:23 -0500

Vishak's avatar

updated 2018-08-06 08:07:52 -0500

Dear All, I have been trying to calibrate a smalloffice DOE prototype. I changed the original model on 4 levels including Roof Insulation, Ext Wall Insulation, WWR-North and WWR-East. During the calibration, electricity and natural gas consumption were being calibrated within 5%. The calibration successfully guessed the WWR-East value and the Ext- Wall Insulation R value however not the Roof and WWR-North values. Do you have any tips on what could help with the calibration? I have attached a picture with the final PAT calculated values and the bounds/std.deviation/deltaX entered in the calculation. Really appreciate any tips..

Vishakhimage description

edit retag flag offensive close merge delete

Comments

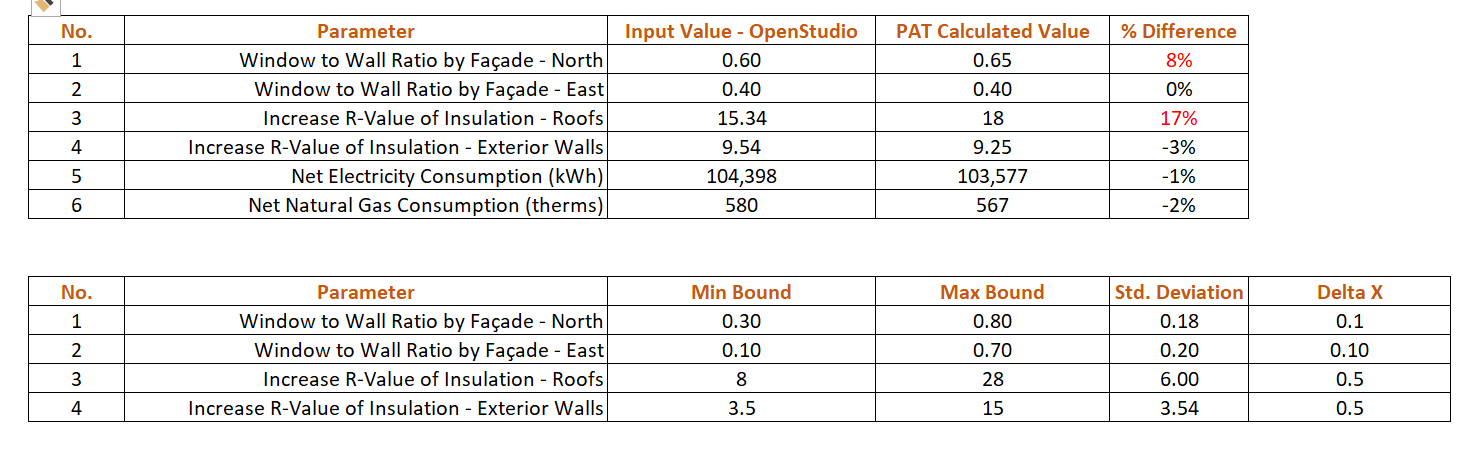
What time resolution are you calibrating against? What is the source of your calibration data? Why only R-value and WWR? WWR is pretty fixed by the building and isn't going to change from 0.3-0.8 or 0.1-0.7 - those are very different buildings. Energy use in most climates tends to not be very sensitive to R-value, so it is really easy to overfit that value.

I recommend running a sensitivity analysis on other major variables (LPD, EPD, schedule parameters / hours of operation) and make sure the most sensitive variables are calibrated first.

mdahlhausen's avatar mdahlhausen  ( 2018-07-27 11:20:05 -0500 )edit

Hi, I am calibrating on a monthly basis. this is my trial run, I setup two Small Office models in OpenStudio using DOE Prototype Building Measure for climate zone 3A. One of the model was plain without any edits and the other model was edited using the above mentioned measures. Subsequently, my goal was to use the plain Small Office Model in PAT, insert exact measures as in Open Studio and have PAT recalculate the values. The source of the .JSON data was the utility consumption values of the 'edited' model.

Vishak's avatar Vishak  ( 2018-07-30 00:45:52 -0500 )edit

1 Answer

Sort by ยป oldest newest most voted
2

answered 2018-07-31 16:01:12 -0500

The type of validation you are doing is resulting in an Under-determined problem, which has an infinite number of solutions. This is the major short coming of most automated, optimization, minimization, etc based calibration techniques. The best you can hope for with this type of approach is to get close to the "right answer", and in practice, even knowing what the "right answer" is remains an open question.

edit flag offensive delete link more

Comments

Hi, What are your thoughts if I were to attempt an hourly calibration and if at all that is possible with PAT. Is there a 'AddJSON 'hourly' measure like the monthly version?

Vishak's avatar Vishak  ( 2018-08-08 11:30:35 -0500 )edit

This measure https://github.com/NREL/OpenStudio-Ca... helps with using timeseries data and converting it to an objective function with different metrics (cvrsme, nmbe, rmse, etc), however that wont change the underdeterminedness of the problem.

BrianLBall's avatar BrianLBall  ( 2018-08-08 11:54:52 -0500 )edit

Hi, I tried using the measure mentioned above for my calibration model. I am using the hourly electric and gas usage CSV files exported from OpenStudio. While running the simulation I encounter a problem "comparison of Float with NaN failed\n " it occurs at creation of Objective function as far as I understand. Do you have any pointers over what can solve this error? Thanks

Vishak's avatar Vishak  ( 2018-08-21 08:07:19 -0500 )edit

"description": "Creates Objective Function from Timeseries Data", "measure_dir_name": "TimeseriesObjectiveFunction", "name": "timeseries_objective_function", "result": { "completed_at": "20180821T125247Z", (....)

"stdout": "[OpenStudio.Measure] <0> OSArgumentVector is deprecated, use OpenStudio::Measure::OSArgumentVector instead.\n", "step_errors": [ "comparison of Float with NaN failed\n

Above is the extract from the OSW file..

Vishak's avatar Vishak  ( 2018-08-21 08:10:06 -0500 )edit
1

you're going to want to look at the datapoint log. you can use the debug or verbose flag in the measure and it will provide a lot of output for debugging. most likely the value from the sql file or the metered data is not setup correctly.

BrianLBall's avatar BrianLBall  ( 2018-08-21 09:47:36 -0500 )edit

Your Answer

Please start posting anonymously - your entry will be published after you log in or create a new account.

Add Answer

Careers

Question Tools

1 follower

Stats

Asked: 2018-07-27 01:59:23 -0500

Seen: 177 times

Last updated: Jul 31 '18