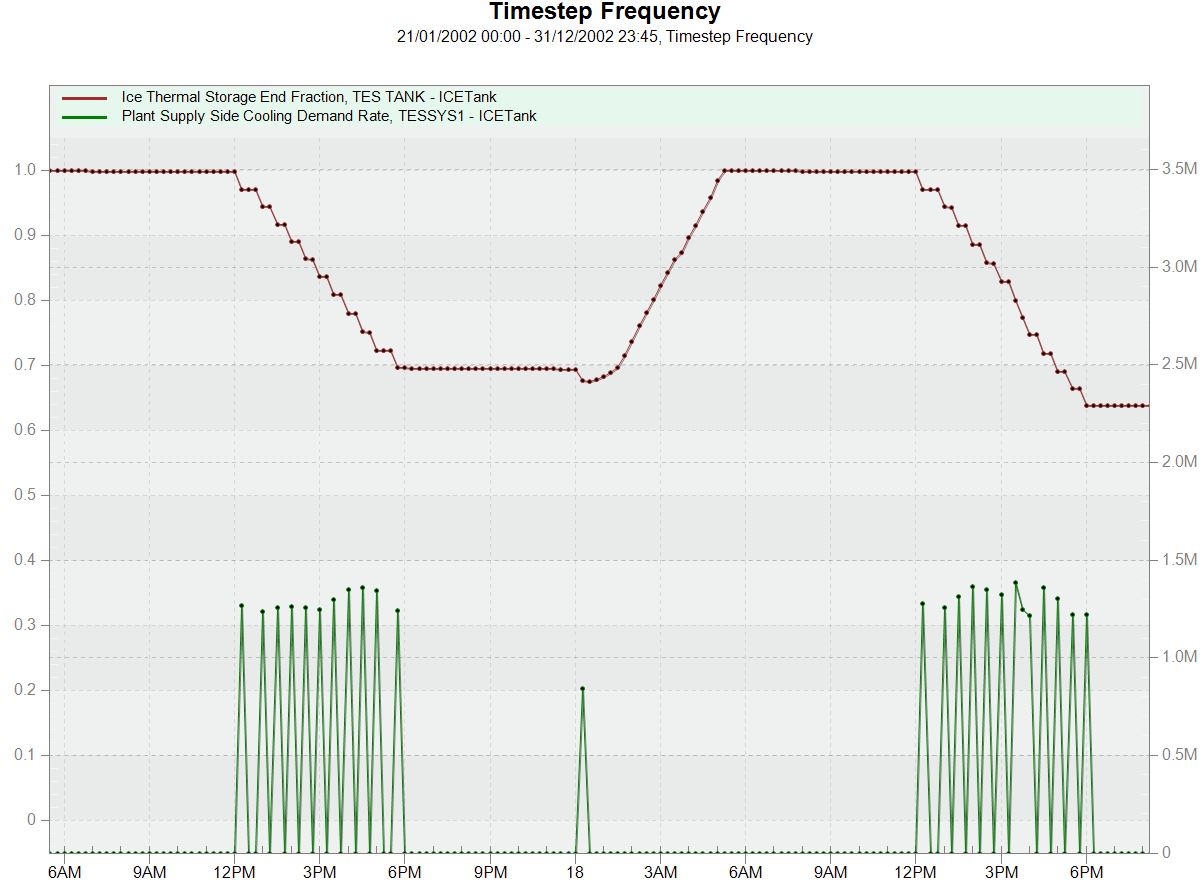
Ice storage model fluctuations during discharge

I have an ice storage model that is showing fluctuations in many output variables and I am trying to under why this is happening. The chiller power follows a similar trend as for cooling demand rate and other storage variables. I am trying to understand what is causing this. I see that the discharge is happening in steps and after each step drop the Cooling demand Rate, chiller power, TES mass flow rate etc. all shoot up till the next discharge step.
I exported the values with Detailed frequency and got a similar profile. Her is the screenshot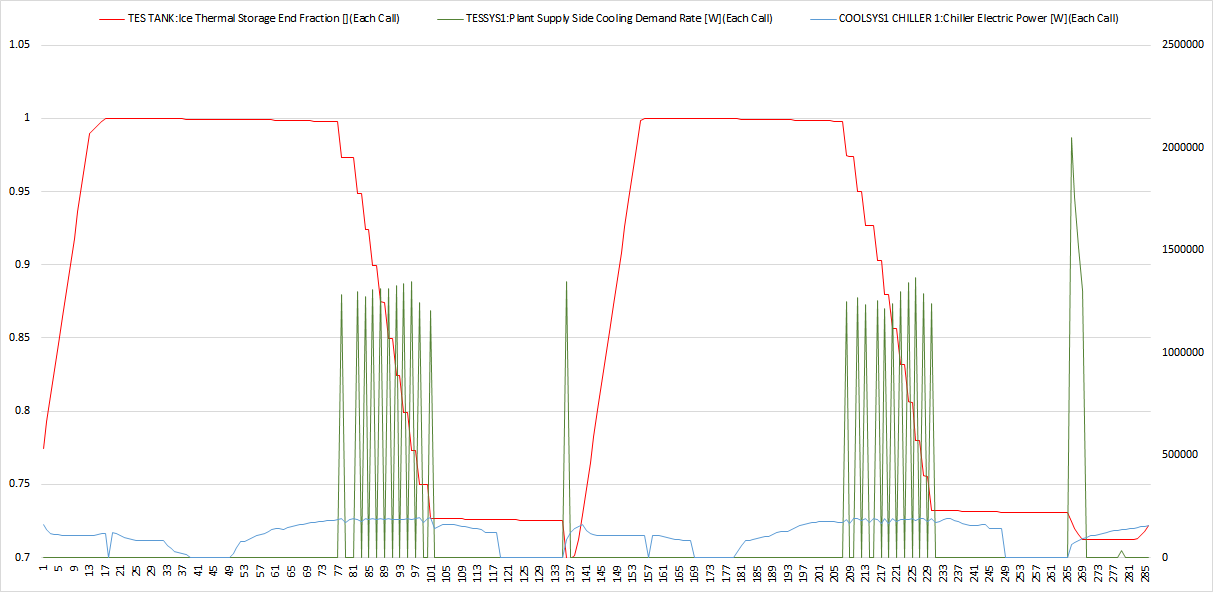 (DesignBuilderResultsViewer of Dview don't open ESO with detailed freq., so plotted data from csv).


Report and plot at the Detailed frequency (=HVAC timestep), not "Timestep" (=zone Timestep) please.