How to summarize values of DGPs?
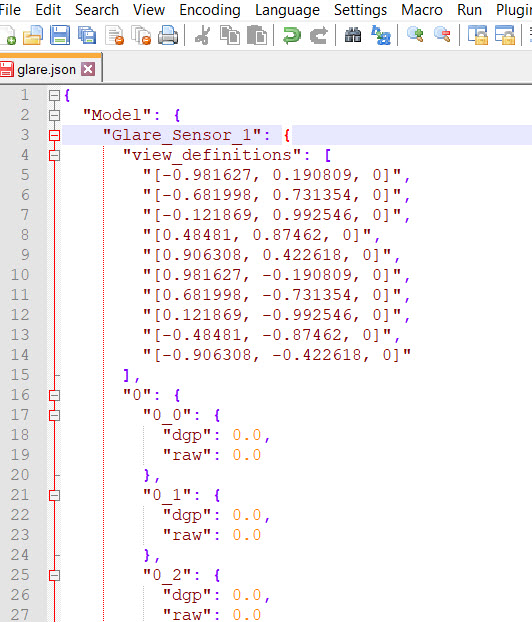
I got glare.json output of my model.
But I do not know how to summarize and average those data. Does OS do that?
THANKS

First time here? Check out the Help page!
I got glare.json output of my model.
But I do not know how to summarize and average those data. Does OS do that?
THANKS

The OpenStudio Radiance measure does just what you see there. For each glare sensor in your model, you get all of the view vectors (i.e. the directions the glare sensors are facing), and then for each one of those vectors, you get all 8,760 hourly values for DGP-simplified and the calculated vertical eye illuminance (keys are named "dgp" and "raw" in the data file, respectively). You could read this data file and summarize or do other types of analyses using any number of tools, e.g. Ruby, R, Python/Pandas, WhatHaveYou...)
In hindsight, we should probably include the x,y,z sensor location coordinates in addition to the view vectors; would be helpful for plotting the results spatially.
I was merely listing some programming languages that would allow you to write a script to read this data and manipulate it and plot it. I have replied to your other question as well since that one was more about the "why" of manipulating this glare data, as opposed to this question which was more of the "how".
Please start posting anonymously - your entry will be published after you log in or create a new account.
Asked: 2018-03-09 13:25:16 -0600
Seen: 234 times
Last updated: Mar 09 '18
