Question-and-Answer Resource for the Building Energy Modeling Community
Get started with the Help page
Ask Your Question
6

Calculating Power, Capacity, and COP from Chiller Curves

asked 2017-09-08 01:34:14 -0500

updated 2017-09-08 07:51:19 -0500

I've seen a few posts related to this subject (here, and here), but I'm still struggling with it. In trying to better understand chiller curves, I've been trying to calculate the hourly power, capacity and COP of chillers based on the resulting curve ratios (or 'modifier multipliers').

In EnergyPlus, I am using the large office reference building for Chicago ("RefBldgLargeOfficeNew2004_Chicago") from the EnergyPlus v8.6 example files. From this I output chiller part load ratio, chiller cycling ratio, chiller electric power, chiller COP, chiller capacity temperature modifier multiplier, chiller EIR temperature modifier multiplier, and chiller EIR part load modifier multiplier.

The COP is 5.5, capacity is auto-sized but the html report shows a capacity of 2,235,557.61 W.

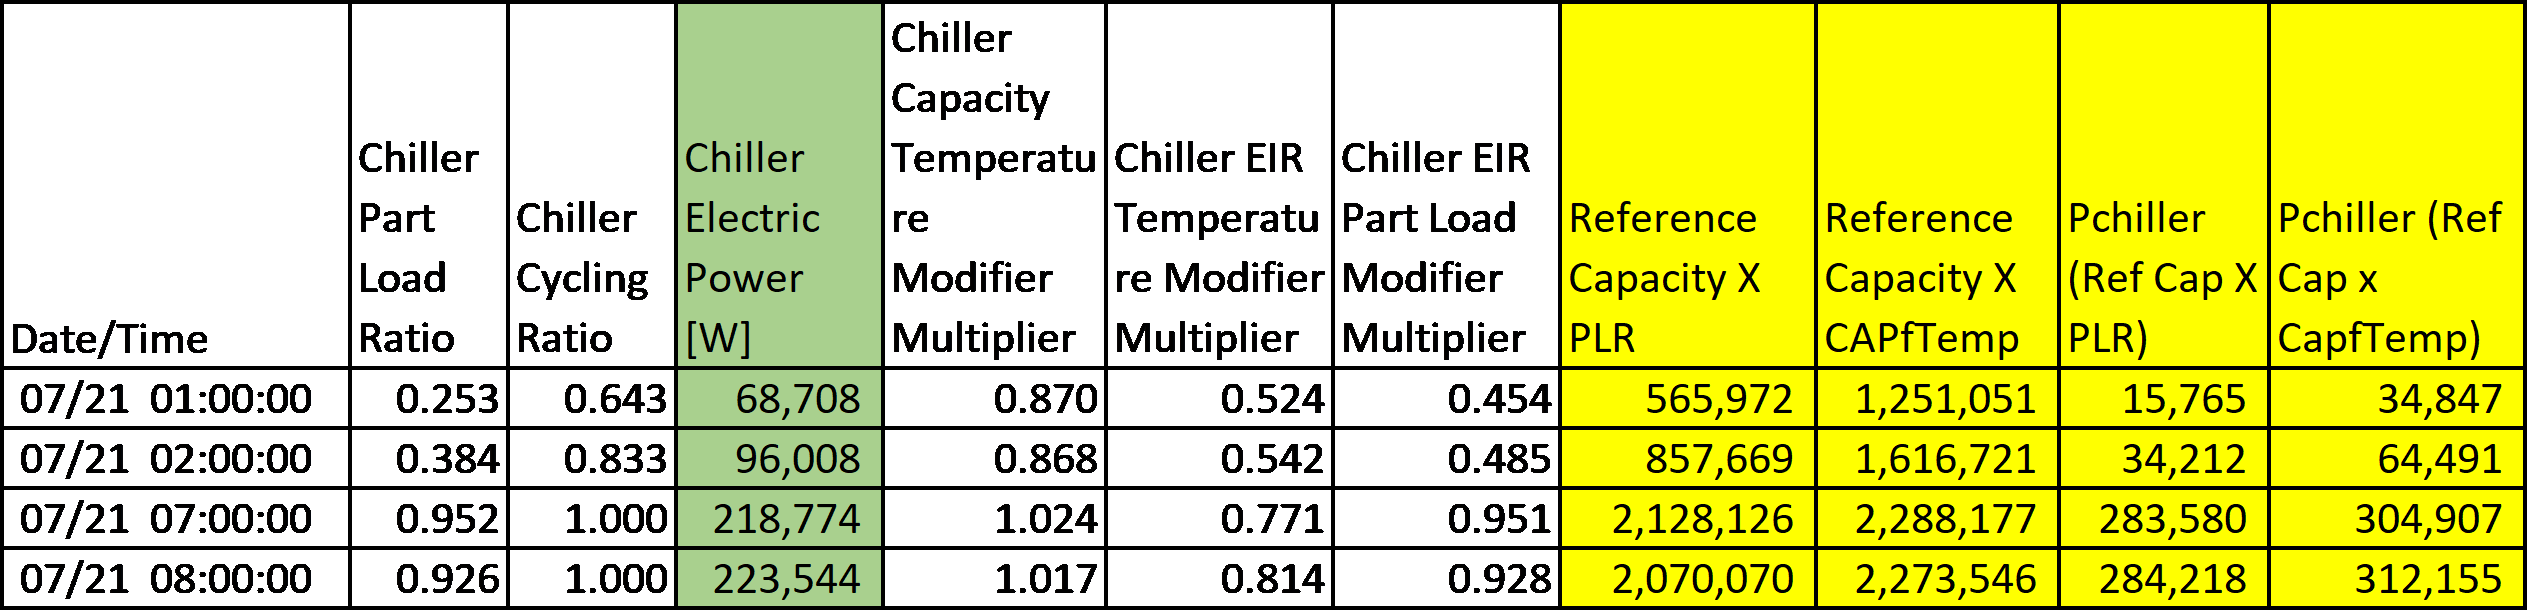
The chiller object is Chiller:Electric:ReformulatedEIR. The engineering reference manual says that the equation for power should be

image description

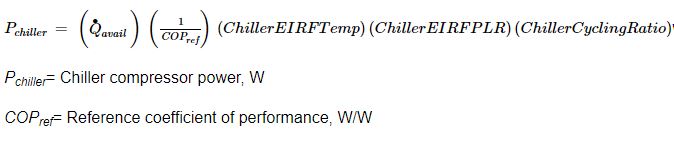
Here is a snippet of the data:

image description


Questions

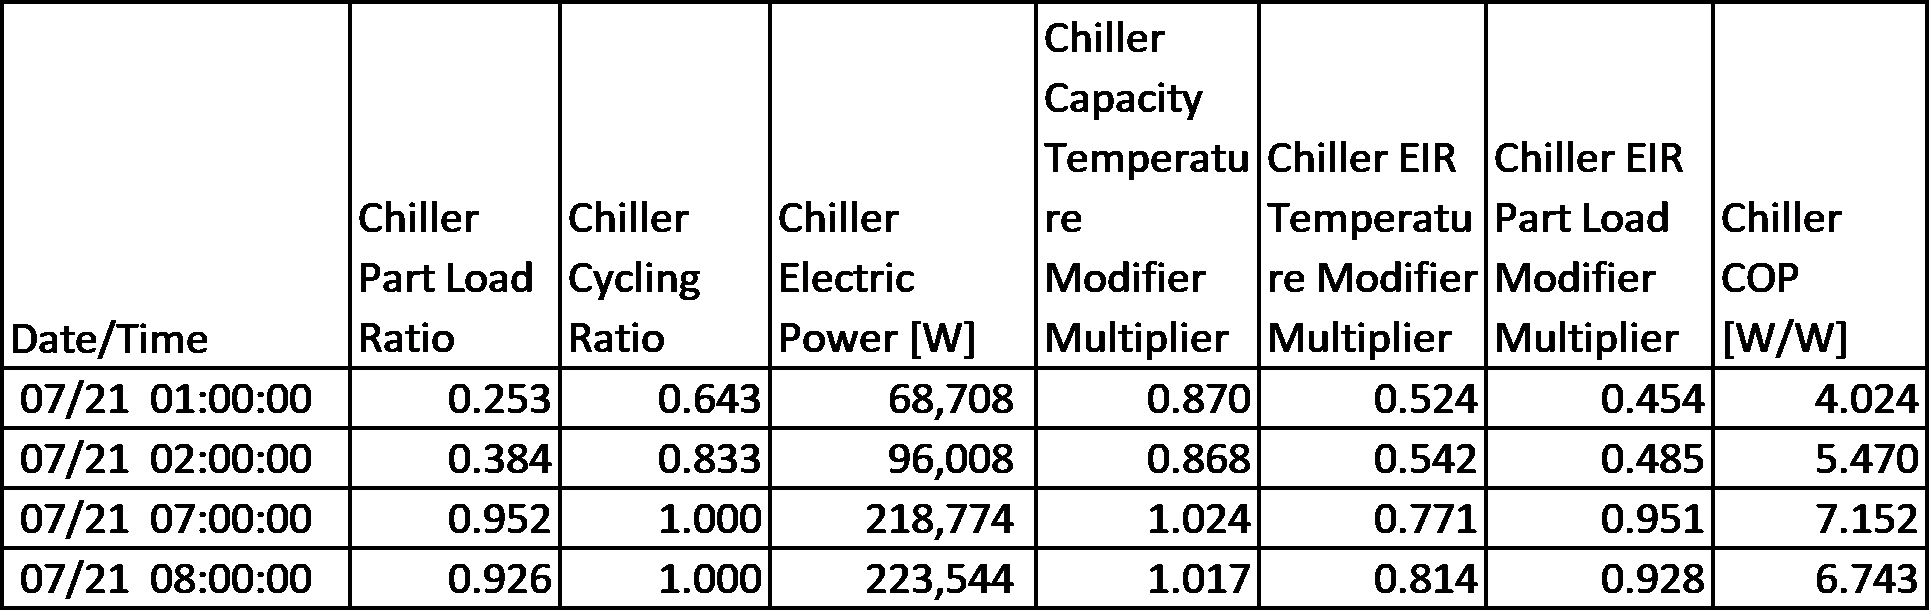
  1. How do I calculate available capacity for each hour? I would think that it would be the reference capacity times the part load ratio, OR the reference capacity times the chiller capacity temperature modifier multiplier but both of these methods give different results.

image description

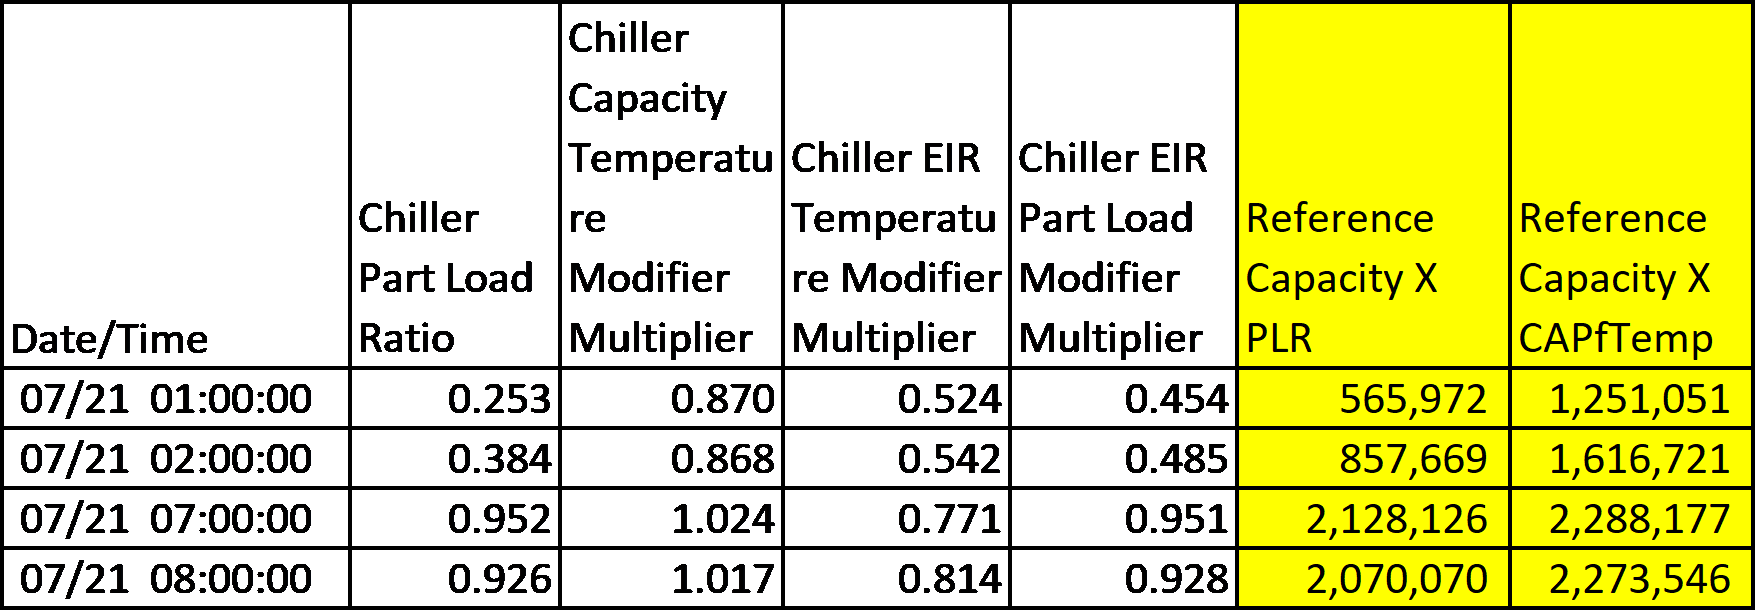
  1. Why when I use the above power equation does it not equal the chiller electric power [W] as output by EnergyPlus? Note that neither of the methods for #1 for calculating capacity make the result of the power equation line up.

image description

  1. What equation would I use to calculate hourly COP or EIR based on the modifier multipliers?
edit retag flag offensive close merge delete

2 Answers

Sort by ยป oldest newest most voted
4

answered 2017-09-08 05:28:36 -0500

Chandan Sharma's avatar

Reporting above outputs at detailed frequency as opposed to hourly would show better comparison. Available capacity is calculated by multiplying reference capacity reported in eio or html output files to ChillerCapFT as mentioned in Engineering reference link above. Note that RefBldgLargeOfficeNew2004_Chicago.idf does HVAC sizing simulation for sizing periods, so for the data snippet posted above Initial Design Size Reference Capacity should be used as opposed to Nominal Capacity. v7 idf shows perfect comparison between manually calculated versus E+ outputs (v7 hourly output, detailed output). Internally, E+ doesn't calculate hourly COP or EIR values.

edit flag offensive delete link more
1

answered 2018-04-19 13:03:01 -0500

Mike Kennedy's avatar

updated 2018-04-19 18:14:39 -0500

Not sure whether this is all water under the bridge but I've found the reported cop to be 1 / ( 1/COPref * EIRfT * EIRfPLR / PLR). I would have thought it would just be 1 / (1/COPref * EIRfT * EIRfPLR). Wish the manual had better definitions of the output variables. Eventually found this answer on the E+ website which straightened me out.

http://energyplus.helpserve.com/Knowl...

edit flag offensive delete link more

Comments

ElectricEIRChiller: ActualCOP = ( QEvaporator + ChillerFalseLoadRate ) / Power;

rraustad's avatar rraustad  ( 2018-04-19 13:12:35 -0500 )edit

Your Answer

Please start posting anonymously - your entry will be published after you log in or create a new account.

Add Answer

Careers

Question Tools

3 followers

Stats

Asked: 2017-09-08 01:34:14 -0500

Seen: 2,482 times

Last updated: Apr 19 '18