How to use the results of the predictor in EMS


I am currently trying to simulate a on-off control, that would turn on only if the predicted load is higher than its nominal capacity.
I am using an EMS script for that, using the sensor Zone Predicted Sensible Load to Setpoint Heat Transfer Rate, with the Model Calling Point AfterPredictorAfterHVACManagers, as described in the example file EMSConstantVolumePurchasedAir
Until now, I am only sensing the value of the predictor, not actuating anything.
I am getting 3 different results for something I was hoping to be the same :
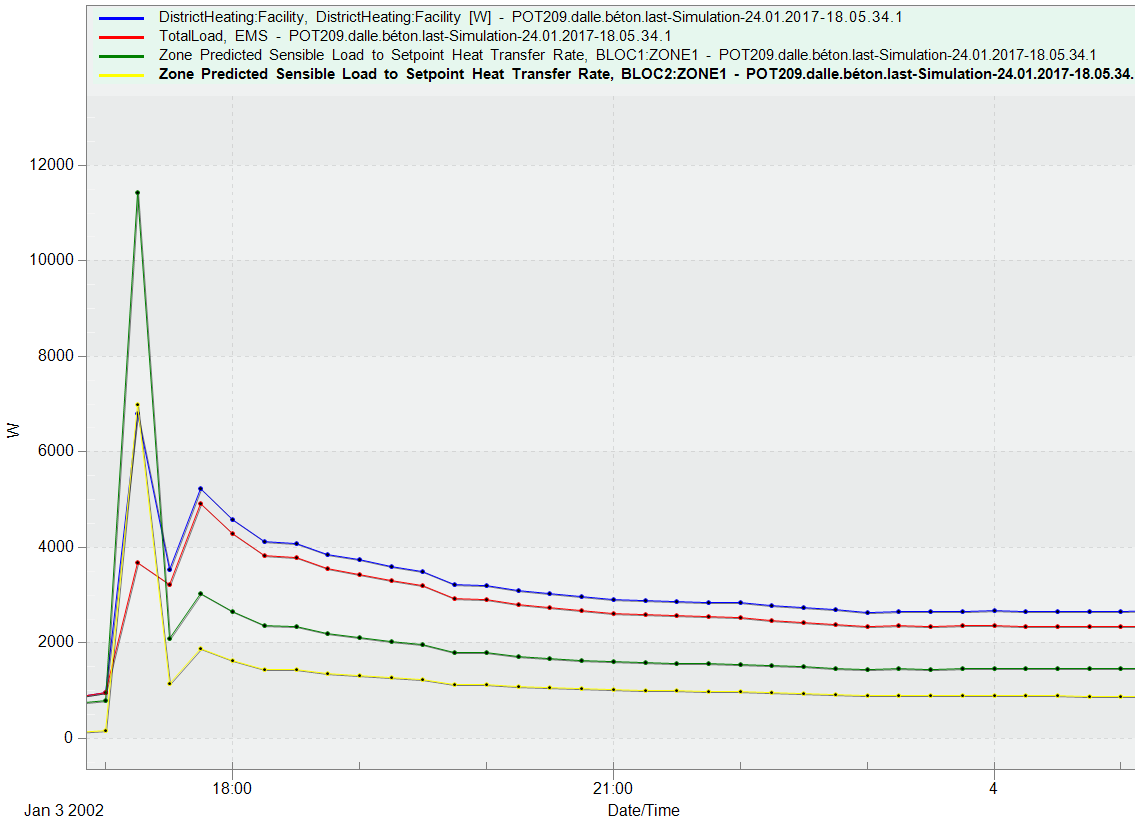
- The ems sensor
Zone Predicted Sensible Load to Setpoint Heat Transfer Rate - The report
DistrictHeating:Facility - The normal report
Output:Variable, *, Zone Predicted Sensible Load to Setpoint Heat Transfer Rate, timestep;
I am pretty sure the difference between the two first is due to the mechanical ventilation loss (with HR) under normal conditions. But there is also a big difference when the thermostat setpoint is changed (+2°C)
How can someone get the real load during an EMS simulation?
And why is the last one (=sum of the two zones) that different from the two others?


"And why is the last one (=sum of the two zones) that different from the two others?" If you do expect yellow+green to equate the two others, I think this is actually the case no?
Not on the second time step : yellow + green = way more ! Even green by itself is above both. But I agree for the other timesteps.
You may not be reporting stuff at the appropriate timestep here (is it at 'detailed'?). And this fringe peak could be the result of many things, including a rapid change in thermostat or something. I wouldn't read too much into it. Look at other days, see if there's a peak too, and if it's around 17:00 as well.
For the difference between first two, you didn't explain why you expect it to be the same, nor what your HVAC system is like. I would expect it to be the same if you had IdealLoadsAirSystem in your building and nothing else.
Yes, it is a result of a change of thermostat, as I explained. Every day at 17:00, there's the "same" peak difference with halved results. But I was still wondering how the real load (so the blue) could be predicted accurately.
Yes, my HVAC system is only IdealAirLoads, as I didn't explain ;) . It's an IdealAirLoads with heat recovery ventilation (80%). And I guess the difference between blue and red is the remaining 20% of cold air blowed in by the ventilation. Which I was expecting to be included in the predictor.
What do you mean by is it at 'detailed'?