Question-and-Answer Resource for the Building Energy Modeling Community
Get started with the Help page
Ask Your Question
3

Higher COP values then reference COP

asked 2016-11-06 21:36:17 -0500

rkbest's avatar

For the annual simulation using Reference Large office building, the annual simulation gives high COP values during winter season than summer. The chiller data and curves are not modified and are similar as the chiller.idf file included in EnergyPlus. image description

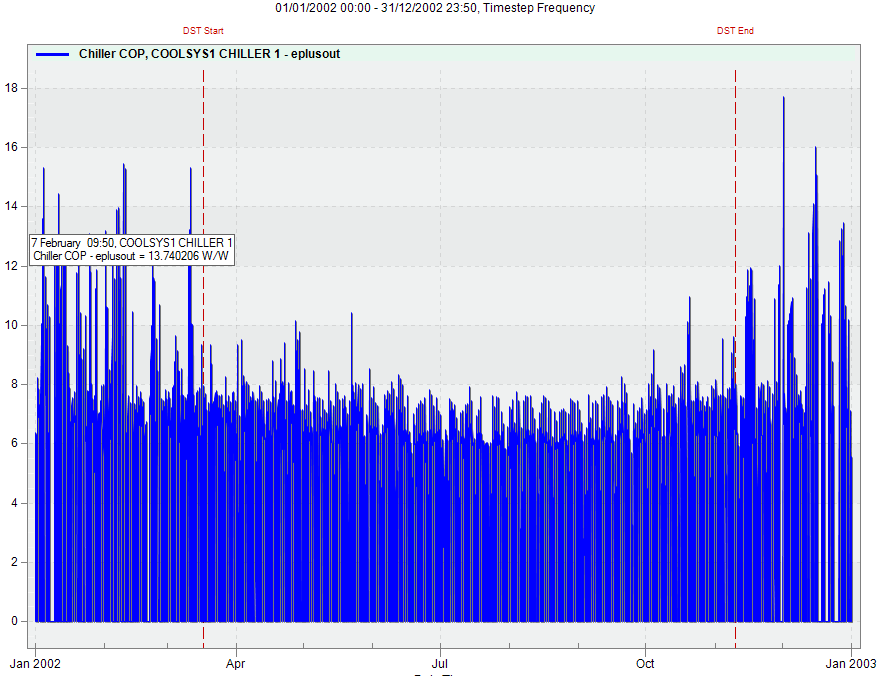
I do not have chiller performance data of my own, hence need to rely on the available chiller curve. The reference chiller COP is set to 5.5 for Chiller:ReformulatedEIR. Even in the most optimally loaded chillers, the COP should not cross 5.5. Any suggestions what could be done to get real like COP's. Or any other chillers and curves that are more accurate in the range of 100-300 tr for Ice storage and CW storage? Chiller - ReformEIRChiller Carrier 19XR 1259kW/6.26COP/Vanes EIRFPLR

edit retag flag offensive close merge delete

1 Answer

Sort by ยป oldest newest most voted
1

answered 2016-11-07 16:36:30 -0500

lyw0211's avatar

Actually, I only used Chiller:Electric:EIR to do the modeling before. But I have a similar situation after using the chiller curves calculated by myself. So I double checked the outputs, including (from .rdd file): Output:Variable,,Chiller Capacity Temperature Modifier Multiplier,hourly; !- HVAC Average [] Output:Variable,,Chiller EIR Temperature Modifier Multiplier,hourly; !- HVAC Average [] Output:Variable,*,Chiller EIR Part Load Modifier Multiplier,hourly; !- HVAC Average [] And then, I found some weird curve feature there and figured out the issue, which is the wrong curve I calculated. Try that to see it is helpful to you.

edit flag offensive delete link more

Comments

I checked those and found the Max Chiller capacity Temp modifier multiplier touching 1.08, EIR Part load modifier multiplier- 0.27, Chiller EIR Temp Modifier Multiplier-0.227 when the COP is about 17 W/W. Were you getting such numbers? What should be the acceptable range and how did you fix it? @lyw0211

rkbest's avatar rkbest  ( 2016-11-07 18:29:24 -0500 )edit

Hey @rkbest, Does the values showed above is the annual average number?It's better to check the hourly value for the whole year. Since I only used the Chiller:Electric:EIR as I mentioned, I'm not sure what does the Chiller:ReformulatedEIR works. Probably the 1st step is to check the rule of "The curve should have a value of 1.0 at the reference temperatures and flow rates specified." And then, read the definition of these 3 curves, which may provides the reasonable range. It is also good to double check the design data for the chiller to make sure all the temperature and flow rate is correct.

lyw0211's avatar lyw0211  ( 2016-11-09 11:21:45 -0500 )edit
lyw0211's avatar lyw0211  ( 2016-11-09 11:22:25 -0500 )edit

Your Answer

Please start posting anonymously - your entry will be published after you log in or create a new account.

Add Answer

Careers

Question Tools

1 follower

Stats

Asked: 2016-11-06 21:36:17 -0500

Seen: 439 times

Last updated: Nov 07 '16