Question-and-Answer Resource for the Building Energy Modeling Community
Get started with the Help page
Ask Your Question
2

Export Result View data to CSV

asked 2016-06-20 02:31:17 -0500

adityord's avatar

updated 2017-09-25 15:17:14 -0500

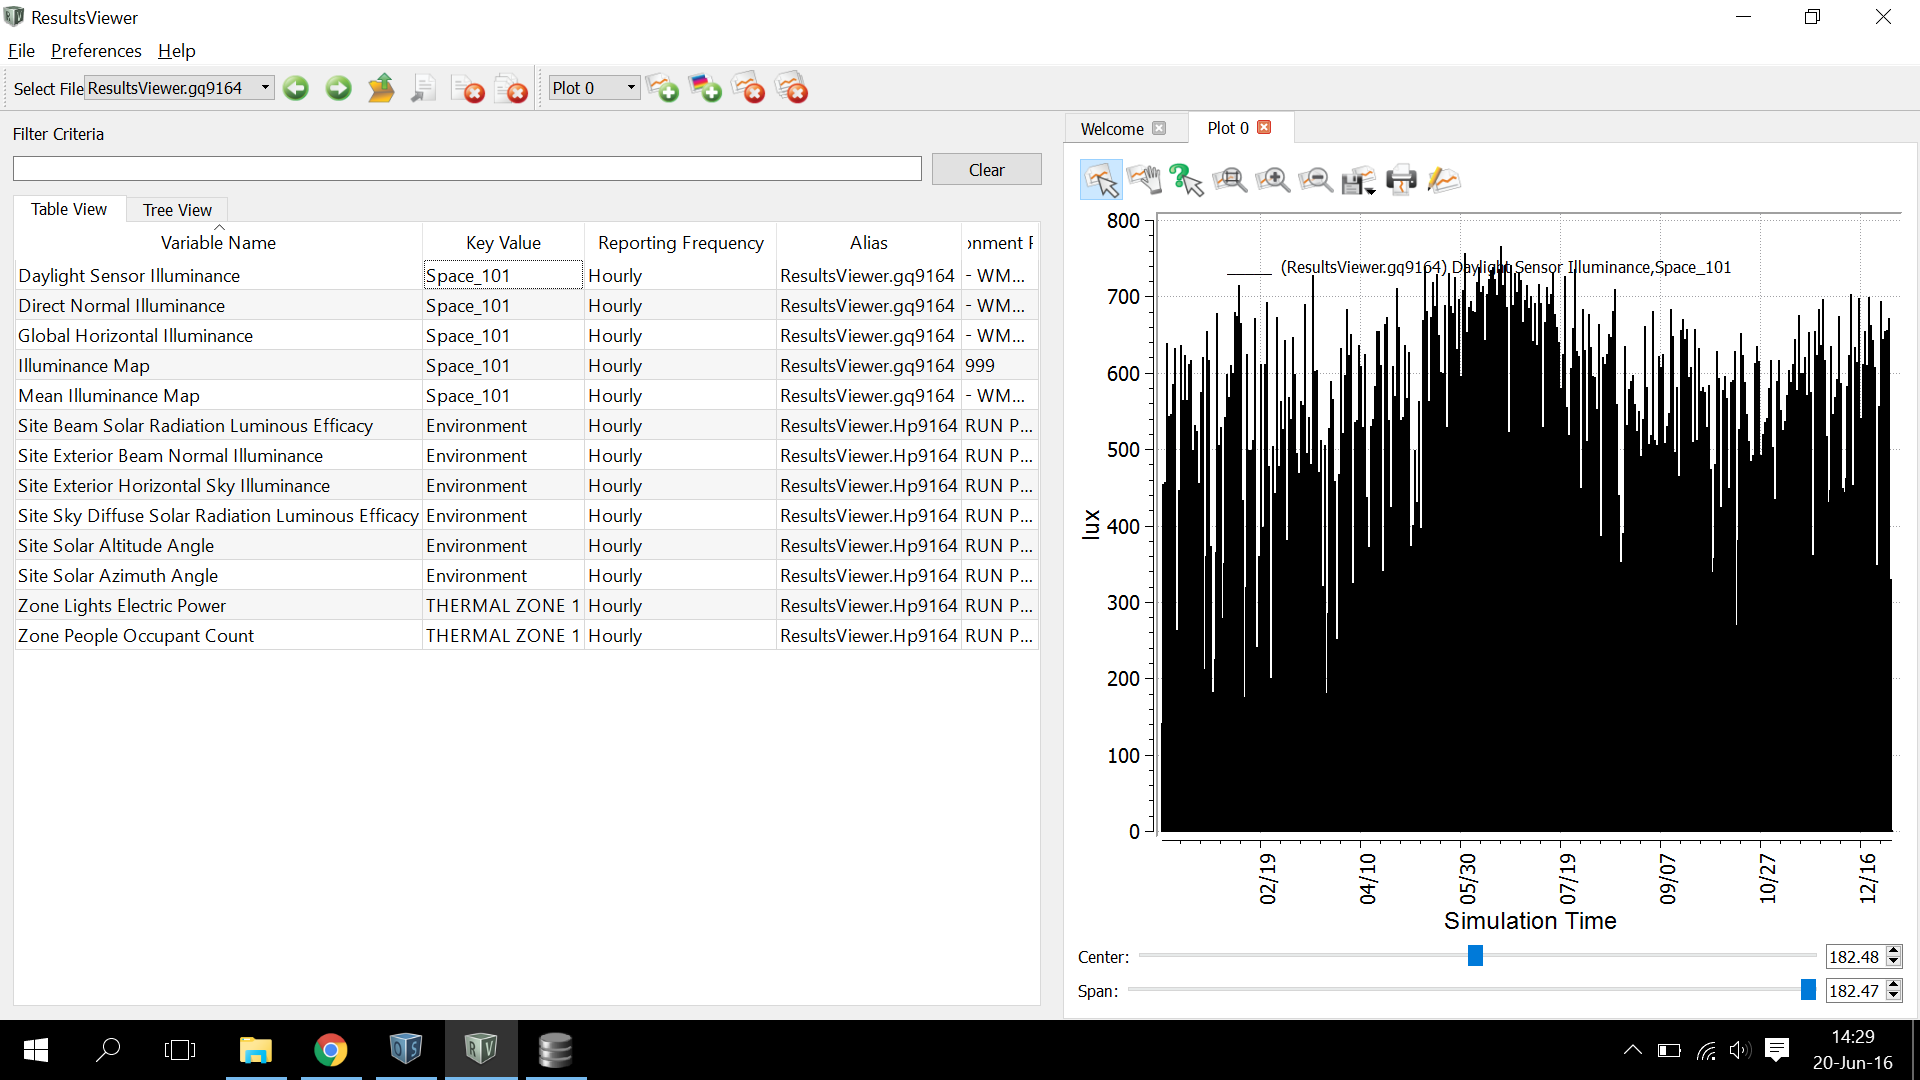
Before, i success to export from RadOut.sql Files to the CSV Files. But still i the result doesnt fulfill my expectation. I Hope that The Result Files (see the Images) the graphic result can export as Excel Data, so i can present the data easily in my report.

image description

By using the DB SQLite Browser, i try to converst the SQL files to CSV Files

image description

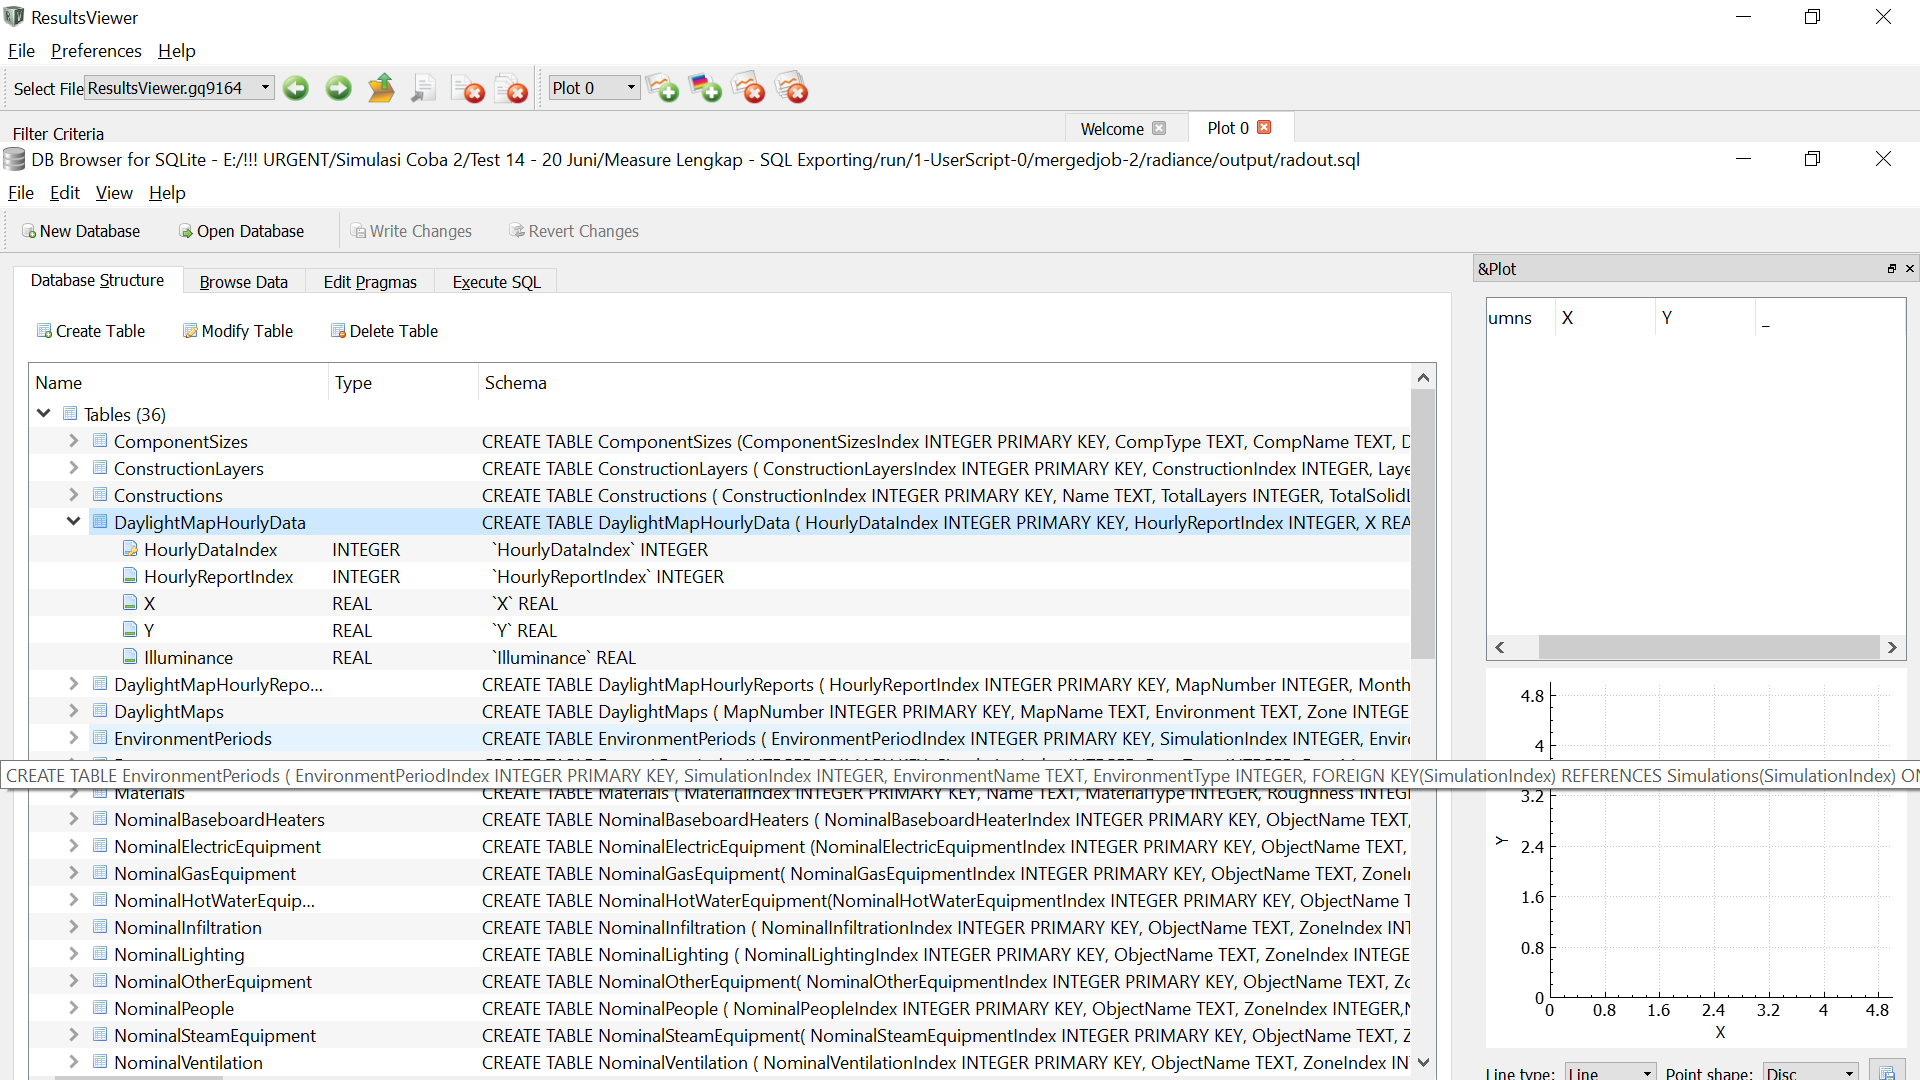
But i cant read The Result (CSV Files converted), i dont know how to read the data.

Can you help me why this is happen? is that the SQL file only read like that? is there any chance that i can read the data more easily? Thankyou

edit retag flag offensive close merge delete

Comments

For addition, this is my Model Files. it complete folder include the SQL Exported files from the SQlite DB Browser https://www.dropbox.com/s/vnn0u1g26e3...

adityord's avatar adityord  ( 2016-06-20 02:34:03 -0500 )edit

May be it would be better to use the built-in E+ daylight calculation as soon as it provides maps in csv format, where you have illuminance data distributed row-by-row so you can easily read them. SQL exports illuminance point-by-point so you need to figure out how to combine them into rows to get a real "map".

Dinosaver's avatar Dinosaver  ( 2016-06-20 02:43:28 -0500 )edit

1 Answer

Sort by ยป oldest newest most voted
1

answered 2016-06-20 11:18:10 -0500

updated 2016-06-20 11:18:50 -0500

The illuminance map data is easily viewed (one space at a time) using Results Viewer, which comes with OpenStudio. This works the same whether you used EnergyPlus for everything, or if you also used the Radiance measure for the daylighting. In the latter case, the illuminance map data will be in radout.sql.

Further, if you use the Radiance measure, each space's illuminance map is saved to a separate CSV file. The file header has all the info you need to reconstruct the data into a grid.

Lastly, all the illuminance map, daylighting control, and glare sensor points that were calculated in the model are stored in the file run/[radiance_measure]/radiance/numeric/merged_space.map. This file has the point location and view vector (x,y,z,vx,vy,vz) of every point. Together with the illuminance output (run/[radiance_measure]/radiance/output/merged_space.ill), you could generate a whole building 3D illuminance map of your data! I'm not saying this is necessarily easy, but the information is there for the plotting. (A "Radiance Data Visualization Report Measure" is on the OpenStudio development team's wish list, but it's a long list.) =)

edit flag offensive delete link more

Your Answer

Please start posting anonymously - your entry will be published after you log in or create a new account.

Add Answer

Careers

Question Tools

1 follower

Stats

Asked: 2016-06-20 02:31:17 -0500

Seen: 700 times

Last updated: Jun 20 '16