Question-and-Answer Resource for the Building Energy Modeling Community
Get started with the Help page
Ask Your Question
1

Energy plus results interpretation [closed]

asked 2016-04-04 04:33:23 -0500

FSilenzi's avatar

updated 2016-04-11 06:33:57 -0500

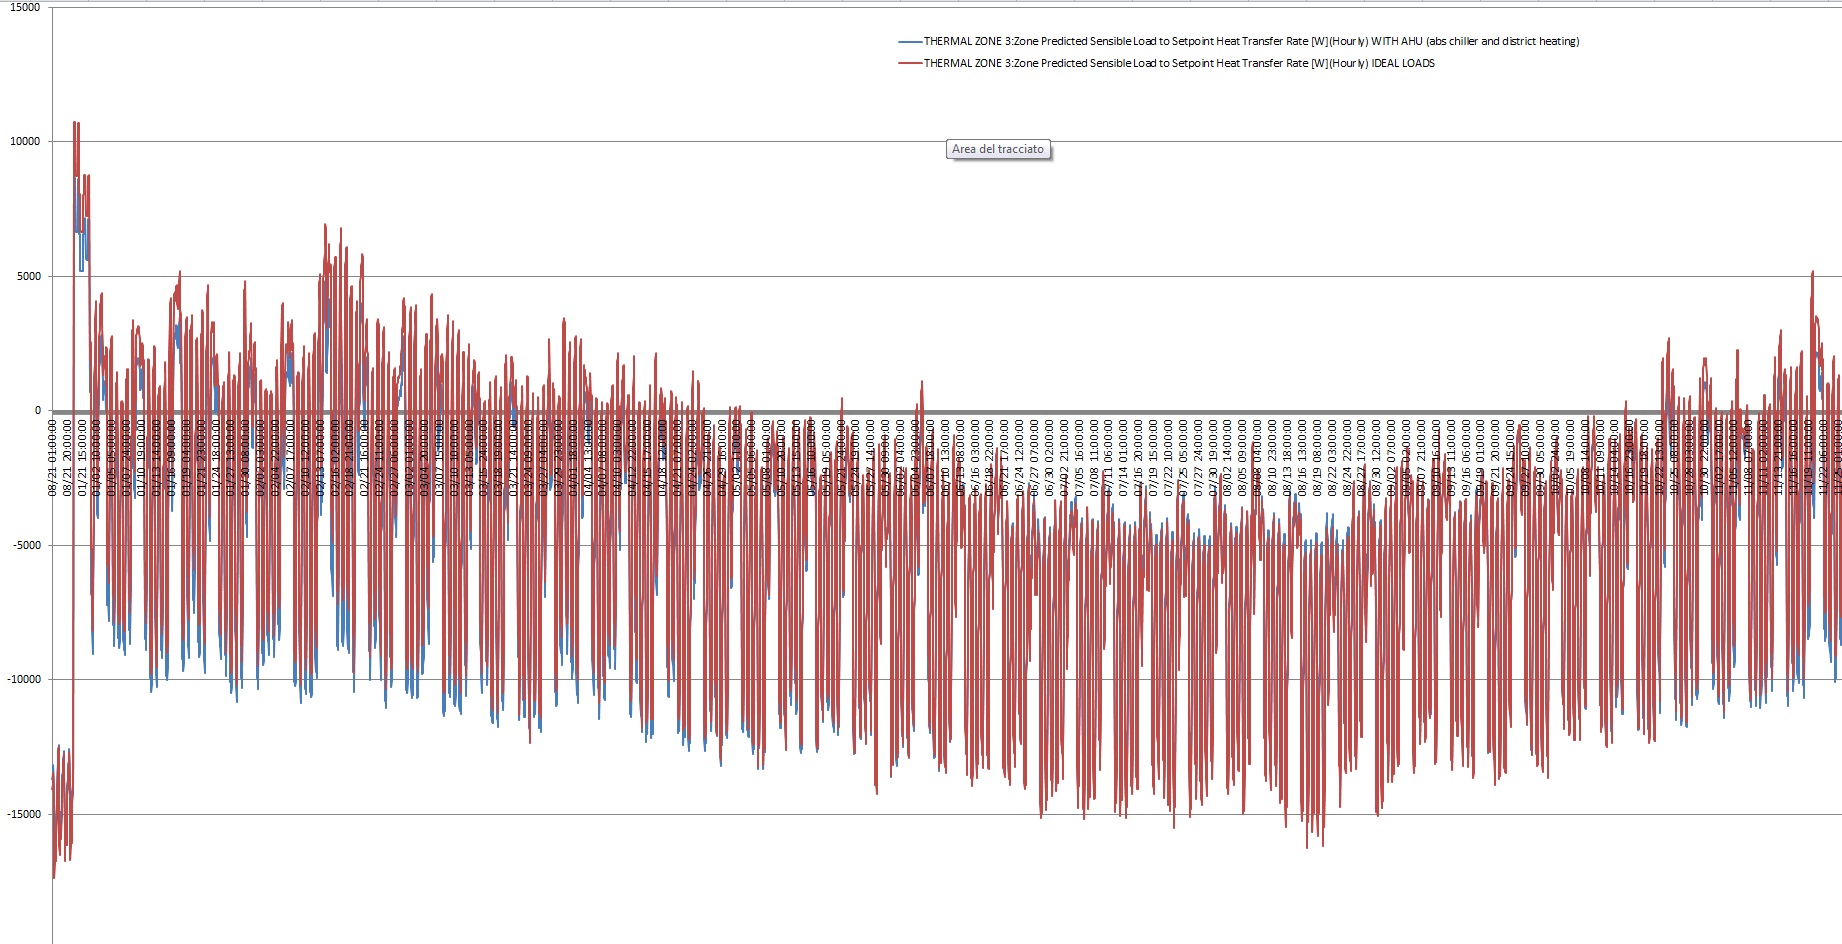
Hi guys, I have used E+ to obtain the output variable Zone Predicted Sensible Load to Setpoint Heat Transfer Rate for both a system connected to a modified VAV with reheat system (with absorption chiller and district heating instead of electric chiller and boiler) and the same system with the "ideal loads" turned on. The system is a simple room, so only 1 thermal zone is modeled. The percentual difference between the two values varies very much: from a simple 1-2% to 500% or more. My question is, since the room is the same (same geometry, fenestration, thermostats, internal loads, weather file and so on) shouldn't the results be very similar? Why there is this huge variability among the two results?

Thanks Federico

edit: I post the pic required image description

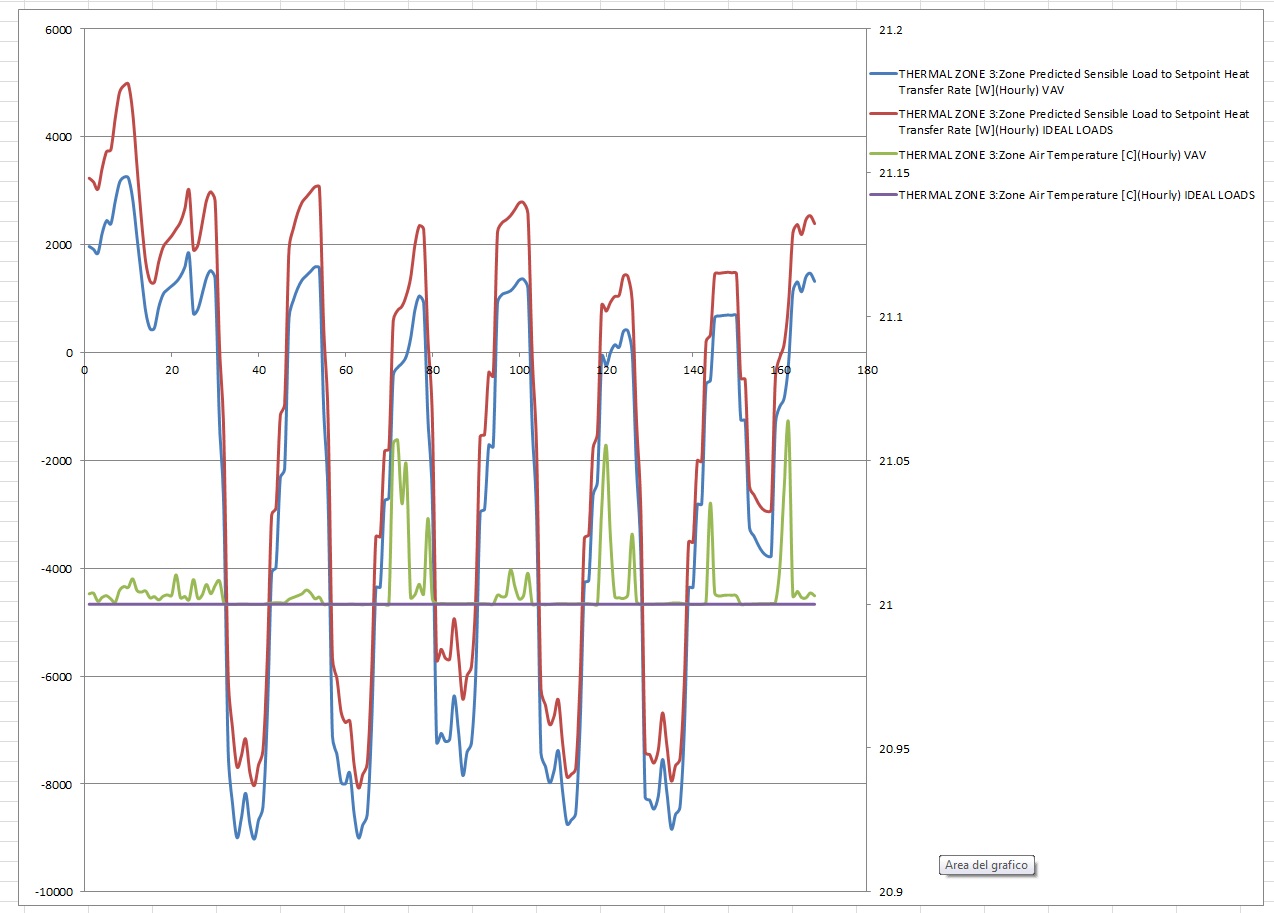
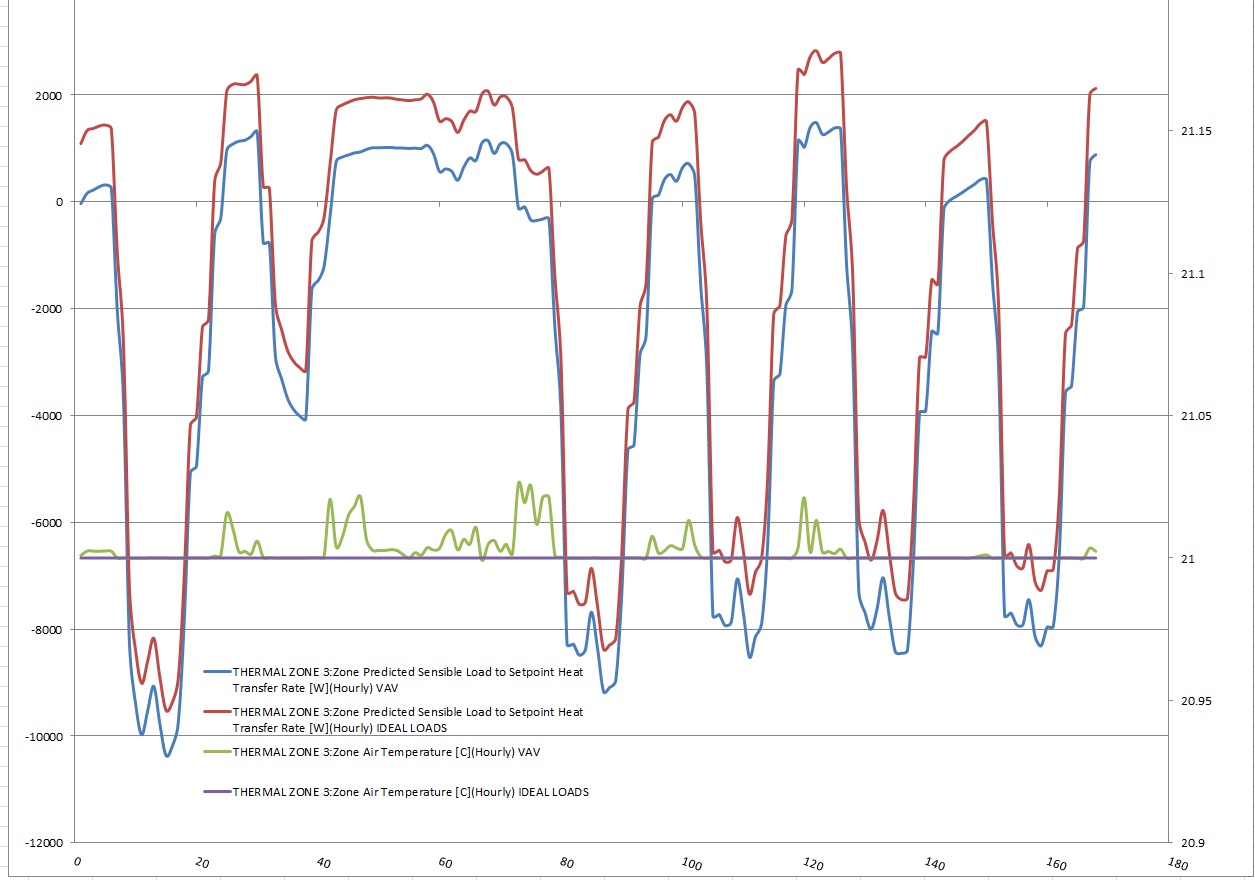
edit: here is the second graph (Revised version) image description

edit: I have added the plots for sim from 1-2-16 to 7-2-16, both thermostats set at 21 °C image description

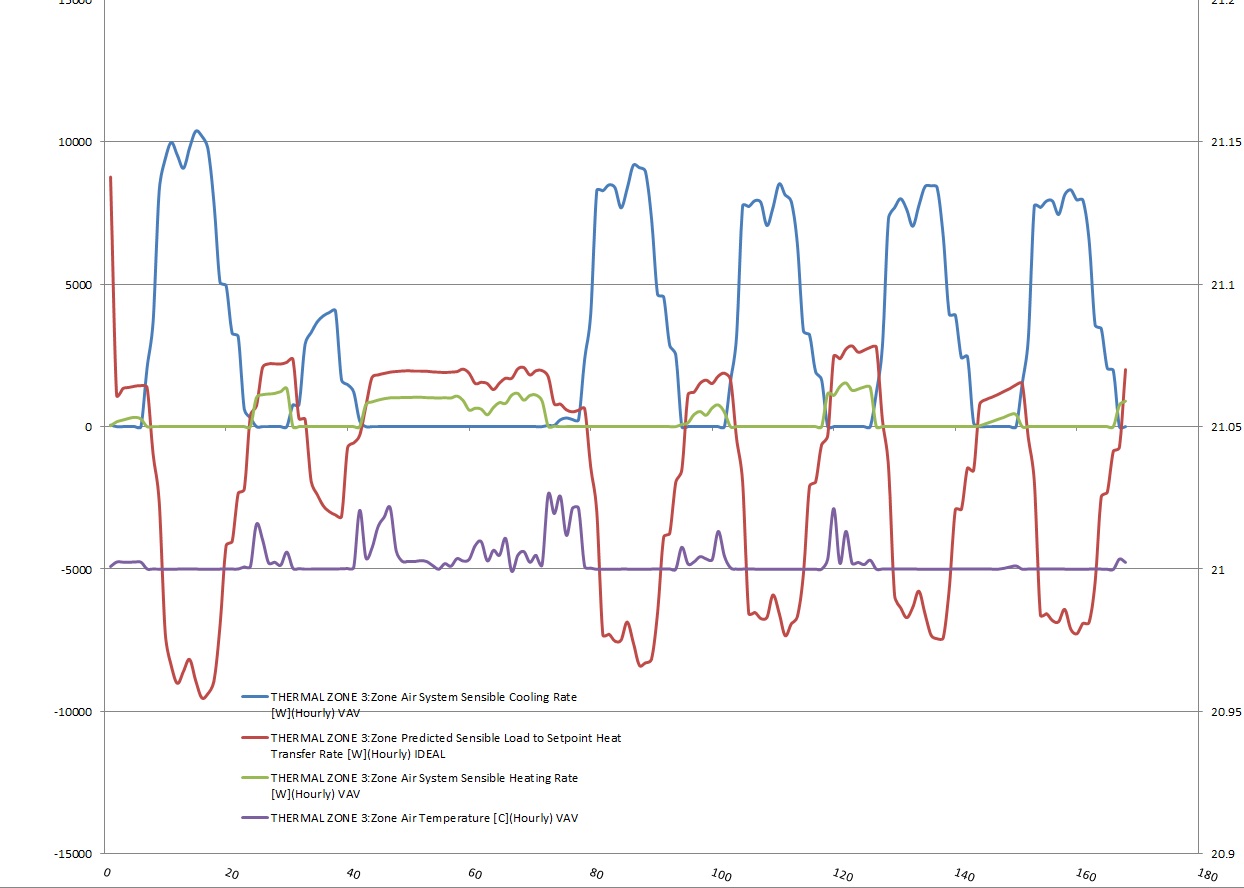
edit: Added the plot requested image description

edit retag flag offensive reopen merge delete

Closed for the following reason question is not relevant or outdated by FSilenzi
close date 2016-06-10 02:40:30.522637

Comments

These simulations look very similar. To help understand what is happening, plot only 1 week and include the zone temperatures (not set point) for each. Plot load on the primary Y axis and zone temperature on the secondary Y axis.

rraustad's avatar rraustad  ( 2016-04-06 09:08:05 -0500 )edit

There is a large difference in zone temperatures which explains the large percentage differences in zone predicted load. Are you sure that both simulations are using a constant 21C thermostat set point temperature?

rraustad's avatar rraustad  ( 2016-04-06 10:07:58 -0500 )edit

The revised version of the second graph shows much better control of zone temperature. The VAV model cannot quite hold a 21C thermostat set point temperature. The higher zone temperature causes more energy storage in the construction materials (thermal history) which results in less need for heating and more need for cooling, as your revised figure shows.

rraustad's avatar rraustad  ( 2016-04-07 07:52:29 -0500 )edit

Try running an ideal loads simulation with the thermostat set point temperature = 21.02C (average zone temperature of the VAV model) to see if the predicted load lines up.

rraustad's avatar rraustad  ( 2016-04-07 07:58:29 -0500 )edit

I have just completed the simulation with ideal loads and thermostat setted to T=21.02 °C. The difference between the two charts is minimal, first values are: -predicted load with ideal loads (T=21 °C) = 3233.904311 W -predicted load with ideal loads (T=21.02 °C) = 3254.634677 W

FSilenzi's avatar FSilenzi  ( 2016-04-07 08:15:36 -0500 )edit

1 Answer

Sort by » oldest newest most voted
3

answered 2016-04-05 18:13:07 -0500

The ideal loads air system will meet the zone load exactly (if chosen to do so) while the VAV system will react to it's available capacity. Check that the zone temperatures are identical. If using setback, change to a constant zone temperature set point and compare the results again. If further help is needed, the input file would be helpful.

edit flag offensive delete link more

Comments

Thank you @rraustad, thanks for the reply. The zone temperatures are identical (zone thermostats are 21 °C) but I am afraid I have not well understood what do you mean with "using a setback". I have, for the VAV system air loop, used a SetpointManager:SingleZone:Reheat, is this setpoint manager that I need to switch to SetpointManager:Scheduled? Thanks

FSilenzi's avatar FSilenzi  ( 2016-04-06 01:50:11 -0500 )edit

Setback means adjusting the thermostat temperature schedule, for example, 28C at night and 24C during the day. It sounds like you are not using setback. The reheat SPM will meet a load, by selecting the flow rate given the current supply air temperature. Zone Predicted Sensible Load should be the same if the zone temperatures are the same. I suspect they are not. Could you post a pic of the zone temps and zone predicted sensible load between the two simulations?

rraustad's avatar rraustad  ( 2016-04-06 07:15:10 -0500 )edit

I am definitely non using setback, the zone thermostat is always set at 21 °C even at night. For the pics, do you want me to post a screen of the CSV file with the zone temp and zone predicted sensible load of both ideal load simulation and VAV system simulation?

FSilenzi's avatar FSilenzi  ( 2016-04-06 07:38:10 -0500 )edit

Just make a graph in excel and post the figure here. You can edit your original post to attach the figure.

rraustad's avatar rraustad  ( 2016-04-06 08:10:42 -0500 )edit

Training Workshops

Careers

Question Tools

1 follower

Stats

Asked: 2016-04-04 04:33:23 -0500

Seen: 548 times

Last updated: Apr 11 '16