Question-and-Answer Resource for the Building Energy Modeling Community
Get started with the Help page
Ask Your Question
3

Trouble-shooting unmet heating hours on EnergyPlus

asked 2015-12-03 18:57:27 -0500

SVVitale's avatar

updated 2020-01-20 13:40:08 -0500

I am using a measure which helps me troubleshoot unmet hours. I have satisfied all of the prompts but I still have about 1000 unmet heating hours. Looking at the helpful graphs and ResultsViewer, I see an interesting pattern that I want to ask about. This graph is for one of two lab zones on my VAV with Reheat HVAC system. Both zones look identical.

image description

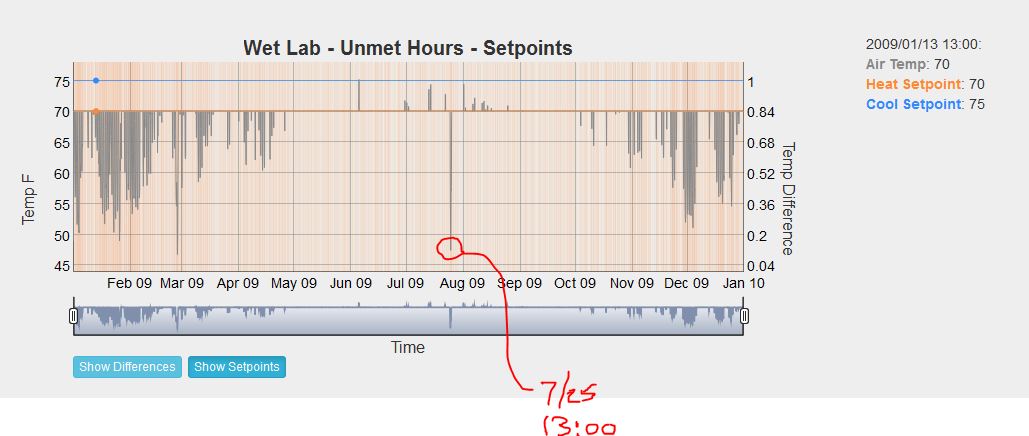
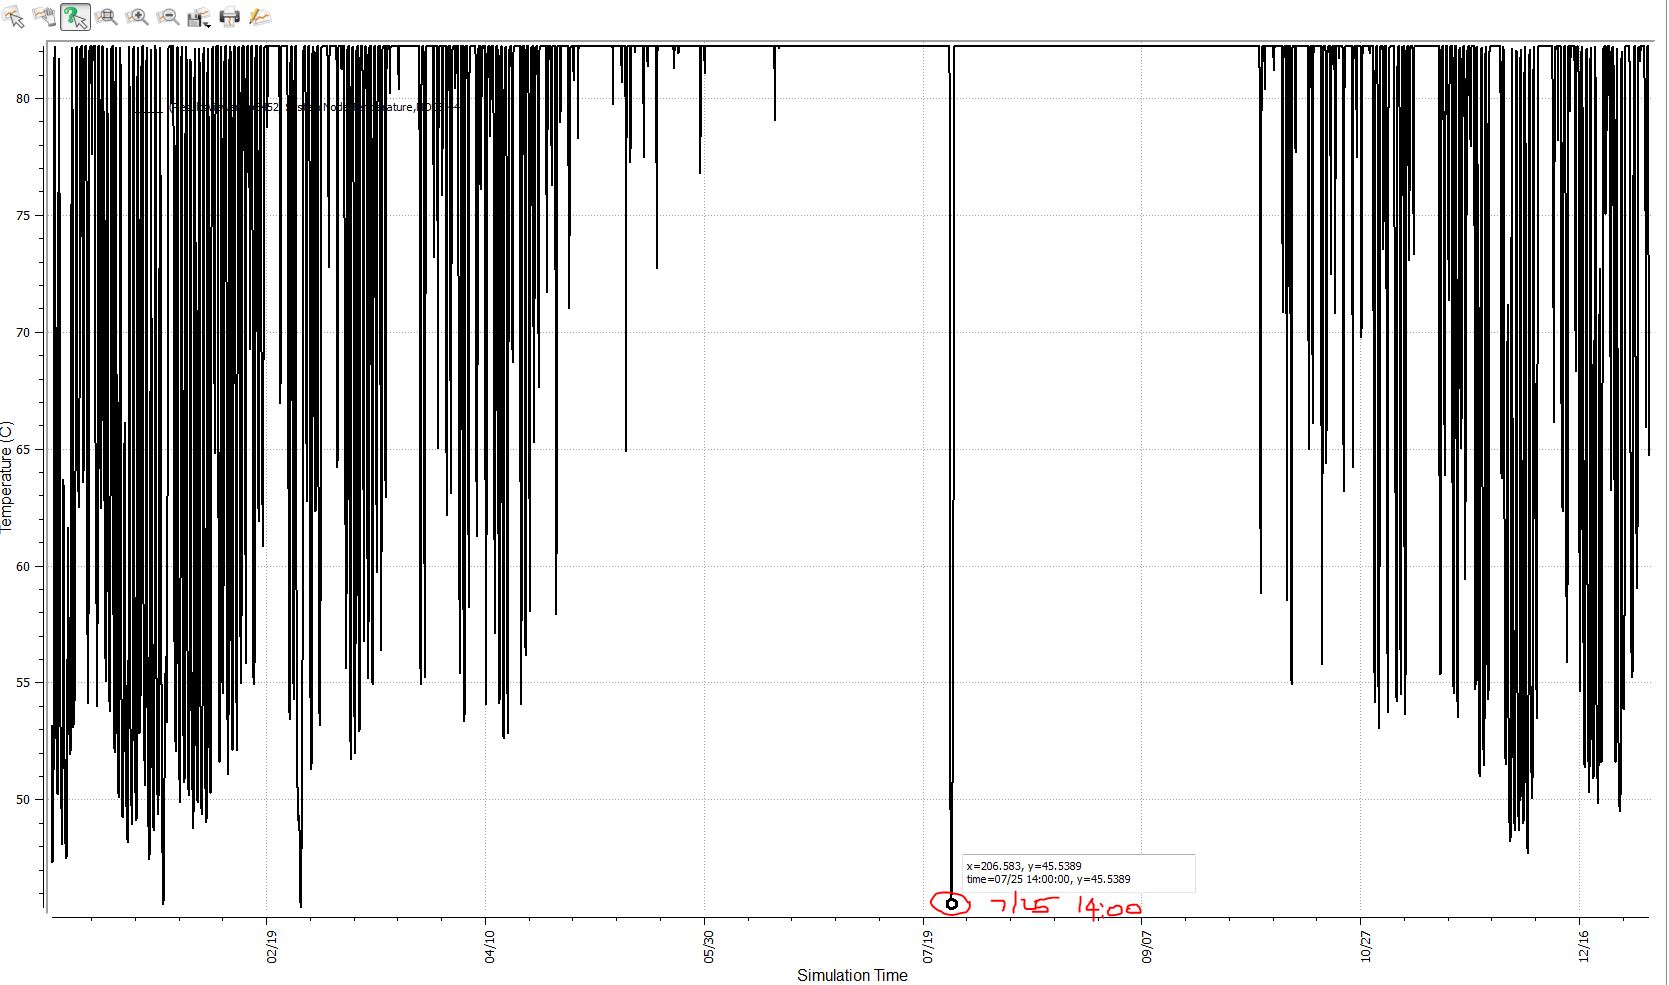
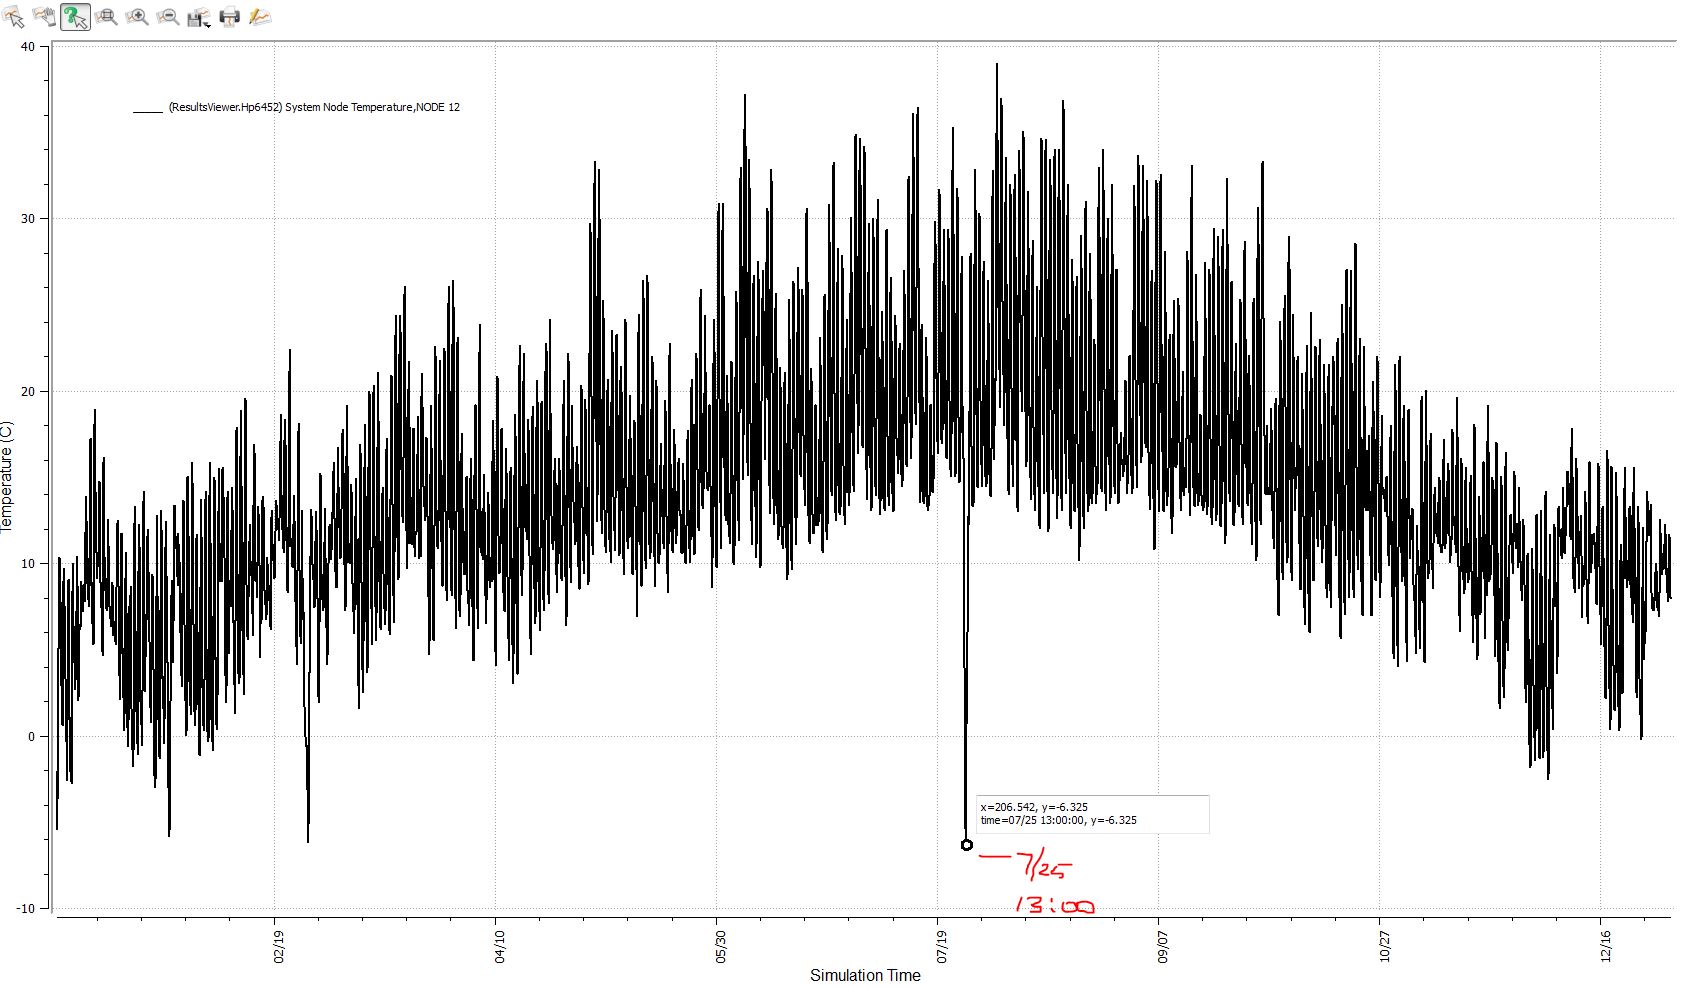
For whatever reason, my zone does not want to heat very well and the "valleys" of my actual zone temperature appear to align very well with patterns in ResultsViewer that I see for my boiler supply temperature which is set via a setpoint schedule that I have made flat year-round at 180 degrees F as well as outside air temperature. See below. The middle valley occurs on July 27 at 13:00 (14:00 for OA temp, but why would I have -6 degrees C (21.2 deg F) OA in the dead of Summer? I have made certain that I am using .EPW and .DDY files for Livermore, CA.

Hot Water Supply Temperature Graph image description

Outdoor Air Temperature Graph image description

Can anyone surmise what the heck is going on here? I don't understand why my actual zone temperatures top-out at my heating setpoint instead of bottoming-out at my heating setpoint. Very weird.

edit retag flag offensive close merge delete

Comments

@SVVitale, took the liberty to change the title because 'EnergyPlus simulation question' can be the title of half the questions on the site. :)

__AmirRoth__'s avatar __AmirRoth__  ( 2015-12-03 20:23:24 -0500 )edit

1 Answer

Sort by ยป oldest newest most voted
4

answered 2015-12-03 19:36:07 -0500

updated 2015-12-03 19:36:18 -0500

The downward spike in your OAT looks like a mistake in the weather file. It happens. You can confirm and manually correct this in the .epw file using a text editor or something like Elements (free). This should fix that anomaly.

The unmet hours are hard to diagnose without the model, but some suggestions:

  1. Are you seeing unmet hours in all zones, or just the labs?
  2. Graph the Air System Outdoor Air Minimum Flow Fraction and the Air System Outdoor Air Flow Fraction. Are your lab zones forcing the entire system to run at 100% OA much of the time?
  3. Graph the boiler part load ratio. Is it running at full capacity during the times you are getting unmet hours?
  4. Graph the VAV terminal damper positions and terminal outlet node temperature and flow. Are the terminals behaving as expected? (this depends on your damper heating action.
  5. If the terminals are maxed out but you still aren't hitting setpoint, check that the Maximum Reheat Air Temperature in the VAV terminal matches the Zone Heating Design Supply Air Temperature (in the Sizing:Zone object for each zone). If you are sizing the zone expecting 105F air, but the terminal only supplies 95F air, you could have unmet hours.
edit flag offensive delete link more

Comments

Thanks. 1. Yes, all zones. I have two zones. Both lab areas. 2&4. Can you advise how to graph the variables you mentioned? My model is deliberately set to force 100% OA at all times because it is a lab. I have zone exhaust which operates on a variable flow schedule and my supply air is trying to track the zone exhaust. My minimum flow fraction for my zone vav box is set to 1 and my design flow is set to follow the same schedule that my zone exhaust fans follow.
3. Once I learn how to graph I will do so. I have my boiler set to auto size but I don't think it is sizing correctly.

SVVitale's avatar SVVitale  ( 2015-12-04 15:09:51 -0500 )edit

I figured out how to do the graphing. Explanation here for anyone else reading this thread that may not know how. I am using a BCL measure called "AddOutputVariable". Using the eplusout.rdd file I looked up the variable names for what you suggested I graph and inserted those names as arguments in the measure. Then the graphing is done by ResultsViewer. I will post another comment with my findings after I review the graphs.

SVVitale's avatar SVVitale  ( 2015-12-05 03:16:17 -0500 )edit

I'm really struggling to figure out where my problem is. Is it appropriate to ask if anyone in the community would be willing to look at my OS model and help me troubleshoot my inputs? My VAV's are all opening up to 100% and my heating flowrate is tracking my fume hood usage schedule. My boiler PLR is not always at 100% and often seems to be too low during the peak heating season. My zones do not want to heat. I get an error that says that my calculated zone heating load is zero. I don't get it. I can post my model, but I'm not sure where/how to post it.

SVVitale's avatar SVVitale  ( 2015-12-07 14:43:06 -0500 )edit

@SVVitale I'll take a look. The best way to share files is to put them on Dropbox, Google Drive, or similar, then post a link here.

aparker's avatar aparker  ( 2015-12-08 17:39:50 -0500 )edit
SVVitale's avatar SVVitale  ( 2015-12-10 13:00:48 -0500 )edit

Your Answer

Please start posting anonymously - your entry will be published after you log in or create a new account.

Add Answer

Careers

Question Tools

2 followers

Stats

Asked: 2015-12-03 18:57:27 -0500

Seen: 652 times

Last updated: Dec 03 '15