First time here? Check out the Help page!

Question-and-Answer Resource for the Building Energy Modeling Community
Get started with the Help page
Ask Your Question
7

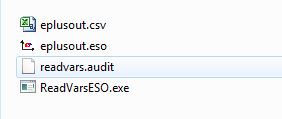
Exporting full (component-level) simulation results to CSV from OpenStudio

asked 9 years ago

updated 7 years ago

I am currently transitioning from ESP-r to EnergyPlus and would like to know how I can export full EnergyPlus simulation results to a .csv file through OpenStudio? If it's not possible, what would be a straightforward way to obtain these?

By full results I am referring to thermal and component side temperatures and flow rates per time step of the simulation.

Preview: (hide)

Comments

Perhaps these can be of assistance. If so, this should probably be closed as a duplicate question.

MatthewSteen's avatar MatthewSteen  ( 9 years ago )

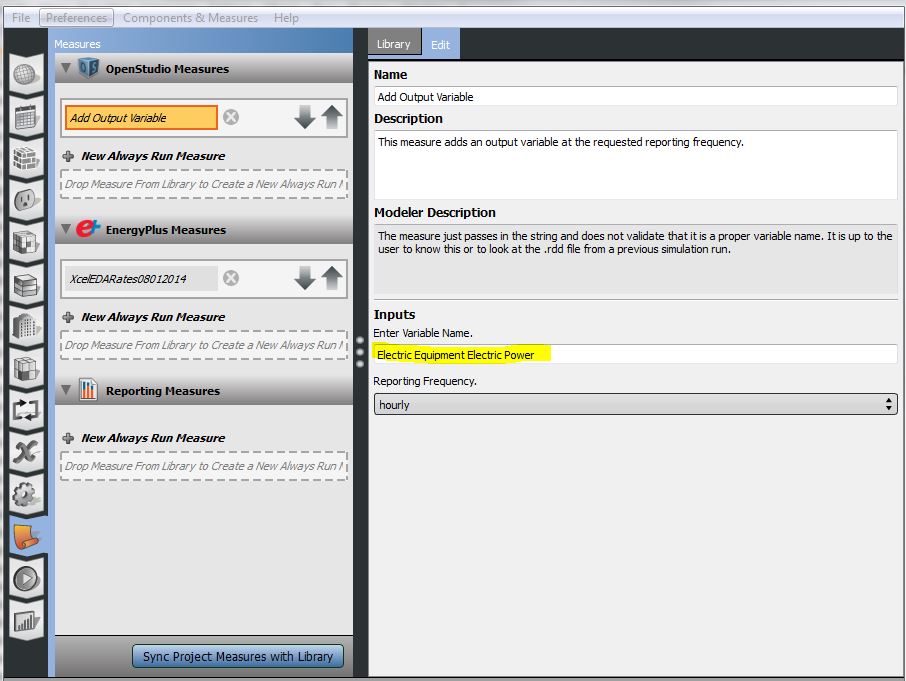
There's one answer that references the Add Output Variable measure but I wouldn't call this question a duplicate. Also @TaylorRoberts answer here is much more complete.

Jamie Bull's avatar Jamie Bull  ( 9 years ago )

1 Answer

Sort by » oldest newest most voted
8

answered 9 years ago

updated 8 years ago

First you need to ask OS for whatever variable you want hourly or sub-hourly reports for. You can use the Add Output Variable script from the BCL and add it to the model in the Always Run Measure area of the measures tab. You can find the available variables in your model from the eplusout.rdd file. Copy in the variable name into the measure:

image description

Once the OS has been ran, you can turn the eplusout.eso file which contains the hourly results into a .csv by using the ReadVarsESO.exe program that comes with E+ located here : C:\EnergyPlusV8-3-0\PostProcess

I usually copy the eplusout.eso file into a empty folder and then also copy in the ReadVarsEAO.exe. Simply double click the ReadVarsESO.exe file and it will create a file called eplusout.csv.

image description

Preview: (hide)
link

Comments

Thanks Taylor! Looks like that's exactly what I was looking for. Can you define and add more than one "Add output variable" scripts, and print more than one parameters in the .csv file? I will try this, play around a bit and report back.

Thanks again!

dsfakianakis's avatar dsfakianakis  ( 9 years ago )

Worked like a charm!

The only nuisance is that along with the hourly zone temperatures, I get ambient temperature values on a 10 min timestep. This leaves a lot of blank cells in the zone temperature columns and would make a possible copy - paste action more challenging. I suppose I could go in the script and change the reporting interval for ambient temperature? If you have any thoughts on that please share, otherwise you can close this topic.

http://tinypic.com/r/av0ykx/8

Thanks again for your help!

dsfakianakis's avatar dsfakianakis  ( 9 years ago )

You were able to fix the problem of the temperatures that appear every ten minutes?

oagb's avatar oagb  ( 8 years ago )

Awesome. Thank you for your answer! It seems like some kind of script (written in Python or C) could be very helpful with this kind of workflow, especially when using the PAT.

njones's avatar njones  ( 7 years ago )

Hi, I added 3 output variables through the measures as explained above, and I can see the results in the ResultsViewer as a graph, but when I convert the eplusout.eso to a CSV file, I cannot see those 3 variables in the excel spreadsheet. Any ides why? Maybe because I added 3 variables and not one? THANKS!

Yael's avatar Yael  ( 7 years ago )

Your Answer

Please start posting anonymously - your entry will be published after you log in or create a new account.

Add Answer

Training Workshops

Careers

Question Tools

4 followers

Stats

Asked: 9 years ago

Seen: 2,449 times

Last updated: Jun 16 '16