Question-and-Answer Resource for the Building Energy Modeling Community
Get started with the Help page
Ask Your Question
1

VRF system shows very low COP in heating mode

asked 2015-08-14 02:14:53 -0500

Daniel Mak's avatar

updated 2015-11-09 14:05:32 -0500

Dear all,

I am modelling a VRF system for a typical office building in Japan (Climate zone 3A). The result indicates that a large proportion of energy goes to heating which is generally not the case in reality.

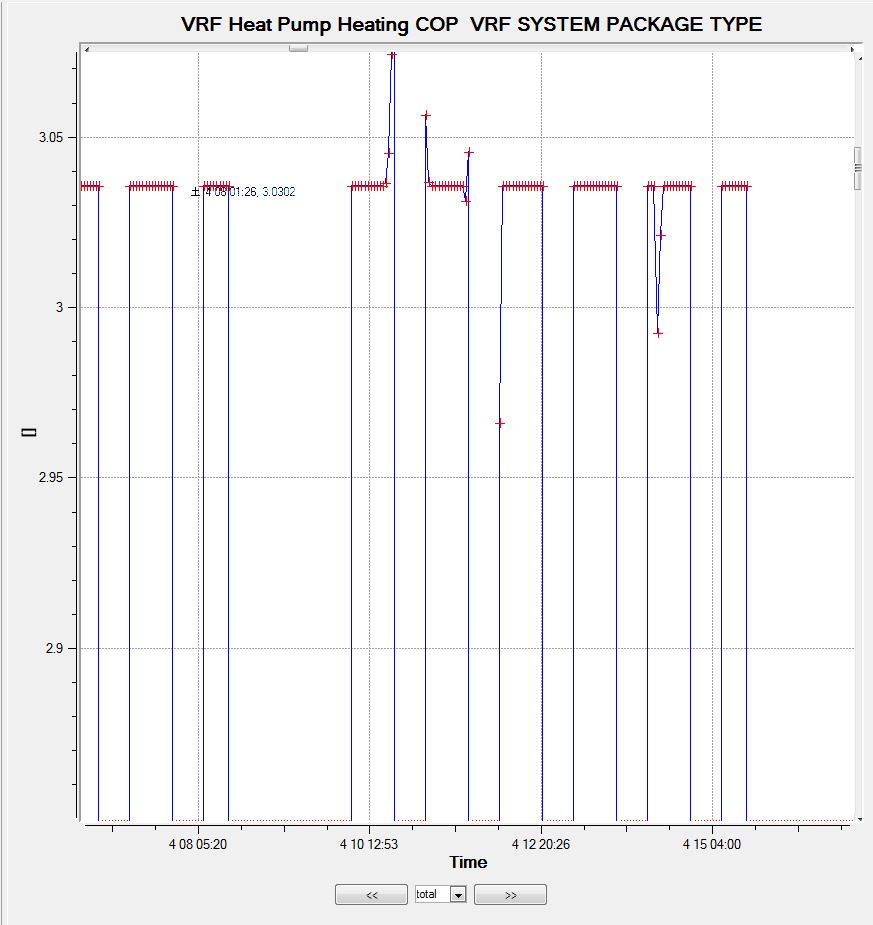
I exported the Openstudio file to Energyplus and called the hourly COP. I found that the COP for heating is constantly a lot lower (1-1.5) than the rated COP which I have inputted (3.5) The COP also appears to reach a max. at around 3.

I am using the default performance curves in Openstudio.

Any ideas what can be done? image description

Regards, Daniel

edit retag flag offensive close merge delete

1 Answer

Sort by ยป oldest newest most voted
3

answered 2015-08-14 18:58:34 -0500

updated 2015-08-14 19:02:18 -0500

I suggest you review the VRF performance curve(s) for EIR. You might input a 3.5 COP, however, as outdoor temperatures fall, the EIR also falls due to the cold weather. It is not uncommon for heat pumps to perform poorly with low COPs in cold weather.

Plot the curve results versus outdoor wet-bulb temperature (or dry-bulb depending on the input field Heating Performance Curve Outdoor Temperature Type). Also include a range of indoor dry-bulb temperatures to see the impact of all possible operation conditions within your simulation/geography. See Figure 7 in http://www.fsec.ucf.edu/en/publicatio...

AirConditioner:VariableRefrigerantFlow,
 VRFHeatEIRFT,  !- Heating Energy Input Ratio Modifier Function of Low Temperature Curve Name
 VRFHeatEIRFTBoundary,    !- Heating Energy Input Ratio Boundary Curve Name
 VRFHeatEIRFTHi,  !- Heating Energy Input Ratio Modifier Function of High Temperature Curve Name
 WetBulbTemperature,      !- Heating Performance Curve Outdoor Temperature Type

Curve:Biquadratic,
  VRFHeatEIRFT,            !- Name
  0.87465501,              !- Coefficient1 Constant
  -0.01319754,             !- Coefficient2 x
  0.00110307,              !- Coefficient3 x**2
  -0.0133118,              !- Coefficient4 y
  0.00089017,              !- Coefficient5 y**2
  -0.00012766,             !- Coefficient6 x*y
  15,                      !- Minimum Value of x
  27,                      !- Maximum Value of x
  -20,                     !- Minimum Value of y
  12,                      !- Maximum Value of y
edit flag offensive delete link more

Comments

Thanks for your comment, the performance curves did seem to be doing something odd. I have changed the curves to the default ones in EnergyPlus and immediately the whole system behaved a lot closer to what I expected. I am still going through the material and may use it to fine-tune the curves.

Daniel Mak's avatar Daniel Mak  ( 2015-08-16 20:27:24 -0500 )edit

Your Answer

Please start posting anonymously - your entry will be published after you log in or create a new account.

Add Answer

Careers

Question Tools

1 follower

Stats

Asked: 2015-08-14 02:14:53 -0500

Seen: 565 times

Last updated: Aug 14 '15