Interpreting Urbanopt-Modelica Simulation Results and Understanding the Time Range
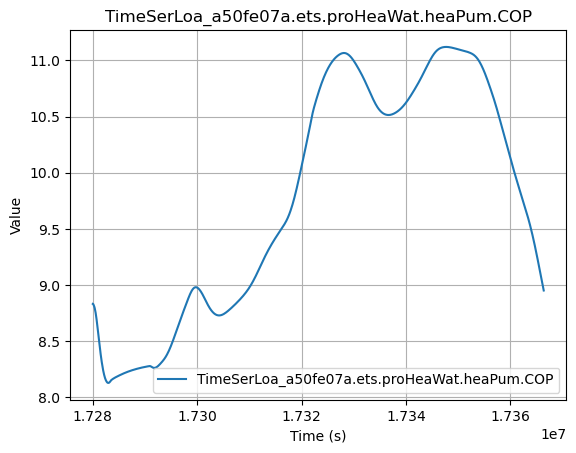
I ran the UrbanOpt example file using the instructions from the UrbanOpt GHP Workflow Documentation (https://docs.urbanopt.net/workflows/g...). The simulation produced results for a specific time range, as shown in the attached image, which spans approximately from 1.728e7 seconds to 1.736e7 seconds.
I need to calculate:
The total amount of electricity consumed by the heat pump. The total amount of heat generated by the system. The associated emissions based on these calculations. I also have the following questions:
Why is the time range in the results limited to this specific interval? Is this expected, or could there be an issue with the setup or data collection process? How can I best interpret the COP values shown in the chart to derive the electricity usage and heat output over this time range? Any guidance on understanding the time range and correctly analyzing these results would be greatly appreciated. Thank you!


