Question-and-Answer Resource for the Building Energy Modeling Community
Get started with the Help page
Ask Your Question
3

Does heat pump have higher peak consumption compared to central ac system?

asked 2024-10-20 18:53:10 -0600

hmmmp's avatar

updated 2024-10-21 12:46:52 -0600

I modeled a single family detached unit with two different cooling systems using openstudio hpxml.

  1. central ac
  2. heat pump (same efficiency rating and capacity for both system)

I varied construction materials i.e., windows (double pane, triple pane), insulation R-values, roof colors, etc to better understand the energy use changes from each cooling system.

I also tested various weather cases (different locations, TMY, AMY, etc).

My results for MAX (Peak Load) vs. Sum (Annual Load) of hourly result of 'End Use: Electricity: Cooling' is shown below. It shows that heat pump (teal color) resulted in higher peak load than central ac (red color).

Why is that? Does higher air temperature make heat pump less efficient? I thought central ac and heat pump are the same for cooling.
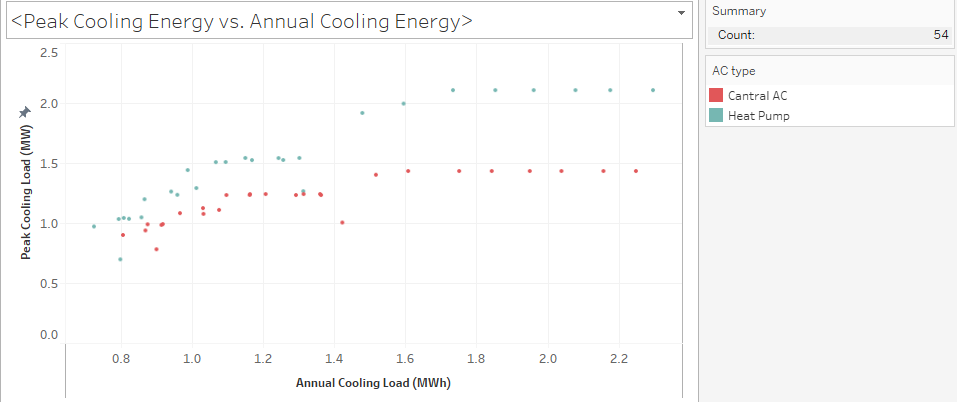
image description

edit retag flag offensive close merge delete

Comments

@hmmmp what simulation tool are you using? Please mention it in the title or body of your post, as well as add a tag so that others can provide better help.

Aaron Boranian's avatar Aaron Boranian  ( 2024-10-21 12:23:51 -0600 )edit

@hmmmp Can you share your HPXML files via e.g. Google Drive or Dropbox?

shorowit's avatar shorowit  ( 2024-10-22 13:55:43 -0600 )edit

Drive

Here are two xml files one heat pump and the other for central ac. I tested with different windows, roof colors, etc.

hmmmp's avatar hmmmp  ( 2024-10-22 15:53:17 -0600 )edit

2 Answers

Sort by ยป oldest newest most voted
4

answered 2024-10-22 18:10:14 -0600

updated 2024-10-22 20:02:49 -0600

I looked at your inputs and found a couple differences that explain this: 1) the HP is variable speed while the central AC is single stage, and 2) the HP has an SHR of 0.78 while the AC has an SHR of 0.73.

If I change these two inputs in the AC file to match the HP file, the results are nearly perfect. See below, where the first column is your AC results, the second column is the AC results with the two input changes, and the third column is your HP results. The 2nd and 3rd column are nearly identical for annual cooling load and peak cooling load.

image description

edit flag offensive delete link more

Comments

Thank you so much for doing this. I really appreciate it. I have one more question. I always thought that variable speed is more efficient/ use less energy to cool the space than the single stage. Is that statement only valid for annual consumption not the max power? I do see that heat pump (variable speed) used slightly less annual energy than the central ac (single stage) in my simulation.

hmmmp's avatar hmmmp  ( 2024-10-23 17:37:51 -0600 )edit

Drive

One more question. When I run my original xml files, time series data is a bit weird. I see cooling load peaking on Feb/18 when it is not particularly hot days. Do you know why it would happen? I uploaded time series excel files and weather file are in the folder.

hmmmp's avatar hmmmp  ( 2024-10-23 21:29:34 -0600 )edit
2

It is counter-intuitive, but a variable speed unit with a given SEER/HSPF will perform worse than a single speed unit with the same rated efficiency, based on the AHRI rating procedures. That said, I don't think you can find single speed and variable speed systems with the same rated efficiency as variable speed units will have higher values.

shorowit's avatar shorowit  ( 2024-10-24 16:31:16 -0600 )edit

If you run the OpenStudio-HPXML simulation with --add-component-loads, you will see that the window conduction and solar loads spike when the cooling load spikes. I plotted the solar data in the weather file and it looks like there is something wrong with a few days in Feb where the Direct Normal is near zero while the Global Horizontal and Diffuse are much larger. Where did this weather file come from?

shorowit's avatar shorowit  ( 2024-10-24 16:44:22 -0600 )edit
1

I have noticed that the weird peak only happens with weather data from IEA EBC

I tested with other weather files and I didn't see those weird behavior.

Thank you so much for looking into this and explaining all these to me.

hmmmp's avatar hmmmp  ( 2024-10-24 18:05:03 -0600 )edit
0

answered 2024-10-22 13:42:34 -0600

sashadf1's avatar

It depends on what type of heat pump you are using. OS-HPXML can model different types of HPs as indicated here.

https://openstudio-hpxml.readthedocs....

Performance curves (https://bigladdersoftware.com/epx/doc...) are used to adjust rated capacity and efficiency depending on environmental conditions, regarding your question about effect of outdoor air temperature on heat pump efficiency.

This reference describes how performance curves are used in the context of residential single speed equipment.

https://bigladdersoftware.com/epx/doc...

edit flag offensive delete link more

Comments

Thank you so much for your response. I don't think I understand all the equations but it looks like cooling load is based on the weather input. Even with the same weather input, heat pump (air source) shown higher max cooling load than central ac controlling for the same cooling capacity (25,000BTUh), efficiency rating (SEER 20), and building construction. I noticed that the timing of max cooling load for those two are very different for certain weather conditions. Heat pump peaking in early September (warm temperature) while central AC peaking in October when the outdoor dry bulb temp is high

hmmmp's avatar hmmmp  ( 2024-10-22 16:32:10 -0600 )edit

Your Answer

Please start posting anonymously - your entry will be published after you log in or create a new account.

Add Answer

Training Workshops

Careers

Question Tools

1 follower

Stats

Asked: 2024-10-20 18:53:10 -0600

Seen: 130 times

Last updated: Oct 22