Question-and-Answer Resource for the Building Energy Modeling Community
| | 1 | initial version |
Bonjour @Santos. Without knowing the range of "mortar plaster" conductivities you're looking into, I ran the following variations to get an idea of some trends:
1.000 W/m.K (high end)
0.656 W/m.K (current value in the .osm)
0.400 W/m.K (low end)
Results (Tunis, single storey building):
k (W/m.K) Heat (GJ) Cool (GJ) Fans (GJ) peak (kW) hours of safety [heat]
_________ _________ _________ _________ _________ ______________________
    1.000      3214       313       484       686                   5169
    0.656      3144       322       482       678                   5106
    0.400      3037       334       478       661                   4590
First, a few observations:
Although I did not plot temperature trends for different zones (during different periods), I'm inferring from the hours of safety (heat) that summer temperatures in free-floating zones (i.e. no AC) often remain near or above 30°C. Without taking any deeper dives or commenting on the magnitude of these numbers, these trends are generally consistent with incremental reductions in material thermal conductivity (given the initial model setup):
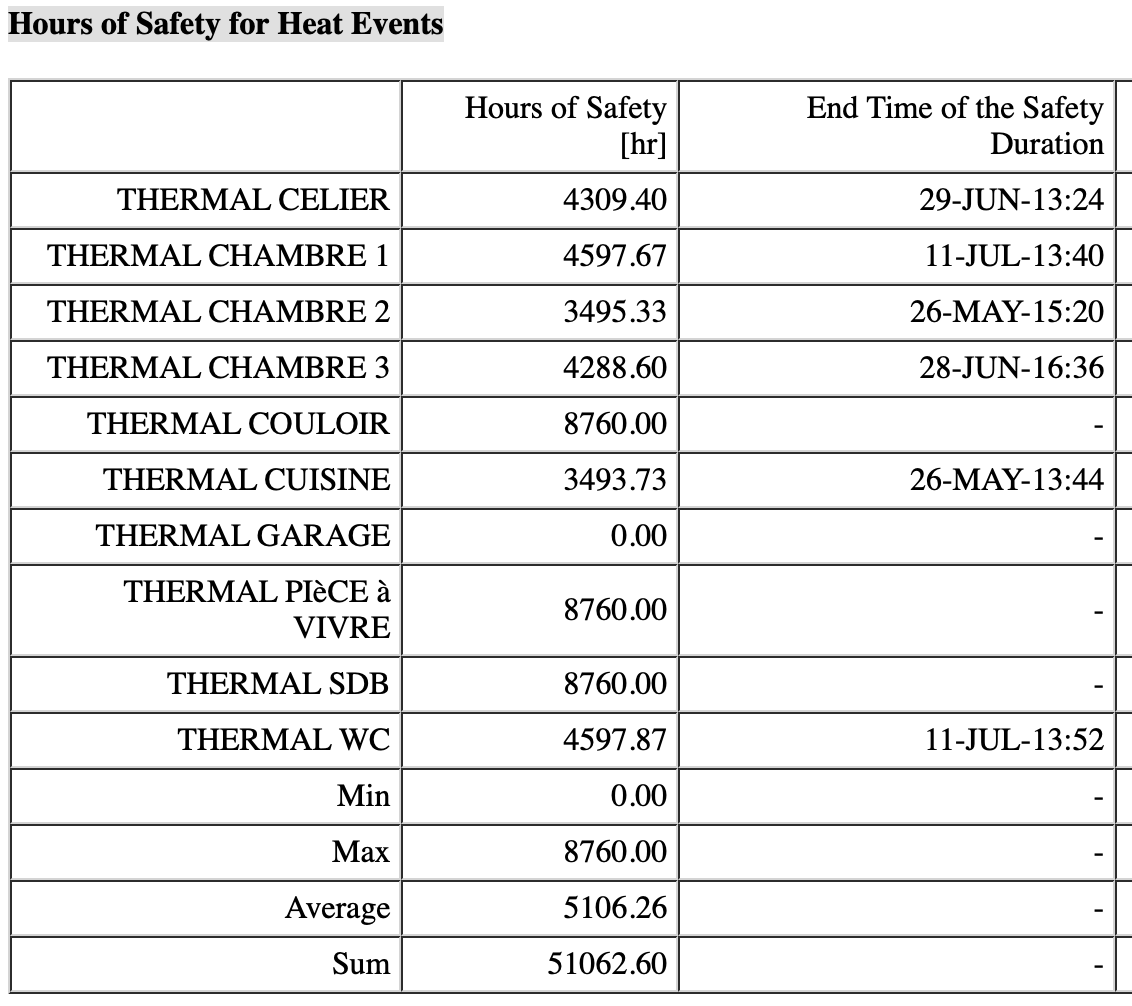
The slight increase in cooling seems counterintuitive. In line with what's summarized here (and in other UMH posts), there are likely periods where outdoor conditions are cool enough to trigger envelope free cooling (e.g. increased surface convection, improved radiative exchanges with the night sky). An improvement in envelope thermal resistance prevents the structure from free cooling (to a degree), hence the slight increase in cooling. Something similar is likely occurring with the number of hours of safety. For free-floating zones, a revised night cooling (natural ventilation) strategy could easily compensate and in fact reverse these two trends. A suggestion.
Avoiding any deeper dives at this stage, as I believe there are some substantial fixes required here. From the above list of rooms, I'm guessing a single family dwelling. Yet the modelled facility is huge:
I'm not seeing the use of multipliers in your model (e.g. a multi-unit residential building), and so the numbers seem generally out of whack for a single residence (at least an order of magnitude too high). I may be completely wrong, but it looks like the dimensions may have either been entered as if in IP, yet really in SI units (17ft instead of 17m), or something wrong happened during translation. Can only speculate. If these are indeed incorrect dimensions, then you would likely need to rehaul model geometry.
I suggest a QAQC exercise before further investigating material conductivities. I'd start with the basics, especially geometry (!), then setpoint/schedule validation, before moving on to key passive cooling strategies like night ventilation (if most spaces are to remain free-floating, i.e. no AC). Maybe even factoring ceiling fans, all towards minimizing heat stress events. Only then, and after getting rid of most of the warnings in the eplusout.err file, would I have enough confidence in simulation results to investigate changes in material conductivities.
Hoping this helps.
| | 2 | No.2 Revision |
Bonjour @Santos. Without knowing the range of "mortar plaster" conductivities you're looking into, I ran the following variations to get an idea of some trends:
1.000 W/m.K (high end)
0.656 W/m.K (current value in the .osm)
0.400 W/m.K (low end)
Results (Tunis, single storey building):building model you referenced here):
k (W/m.K) Heat (GJ) Cool (GJ) Fans (GJ) peak (kW) hours of safety [heat]
_________ _________ _________ _________ _________ ______________________
    1.000      3214       313       484       686                   5169
    0.656      3144       322       482       678                   5106
    0.400      3037       334       478       661                   4590
First, a few observations:
Although I did not plot temperature trends for different zones (during different periods), I'm inferring from the hours of safety (heat) that summer temperatures in free-floating zones (i.e. no AC) often remain near or above 30°C. Without taking any deeper dives or commenting on the magnitude of these numbers, these trends are generally consistent with incremental reductions in material thermal conductivity (given the initial model setup):
The slight increase in cooling seems counterintuitive. In line with what's summarized here (and in other UMH posts), there are likely periods where outdoor conditions are cool enough to trigger envelope free cooling (e.g. increased surface convection, improved radiative exchanges with the night sky). An improvement in envelope thermal resistance prevents the structure from free cooling (to a degree), hence the slight increase in cooling. Something similar is likely occurring with the number of hours of safety. For free-floating zones, a revised night cooling (natural ventilation) strategy could easily compensate and in fact reverse these two trends. A suggestion.
Avoiding any deeper dives at this stage, as I believe there are some substantial fixes required here. From the above list of rooms, I'm guessing a single family dwelling. Yet the modelled facility is huge:huge:
I'm not seeing the use of multipliers in your model (e.g. a multi-unit residential building), and so the numbers seem generally out of whack for a single residence (at least an order of magnitude too high). I may be completely wrong, but it looks like the dimensions may have either been entered as if in IP, yet really in SI units (17ft instead of 17m), or something wrong happened during translation. Can only speculate. If these are indeed incorrect dimensions, then you would likely need to rehaul model geometry.
I suggest a QAQC exercise before further investigating material conductivities. I'd start with the basics, especially geometry (!), then setpoint/schedule validation, before moving on to key passive cooling strategies like night ventilation (if most spaces are to remain free-floating, i.e. no AC). Maybe even factoring ceiling fans, all towards minimizing heat stress events. Only then, and after getting rid of most of the warnings in the eplusout.err file, would I have enough confidence in simulation results to investigate changes in material conductivities.
Hoping this helps.

