 | 1 | initial version |
The major thing that seems to have changes is the "Zone Component Load Summary" report name now includes spaces, where the measure uses "ZoneComponentLoadSummary" in the queries of the sql file.
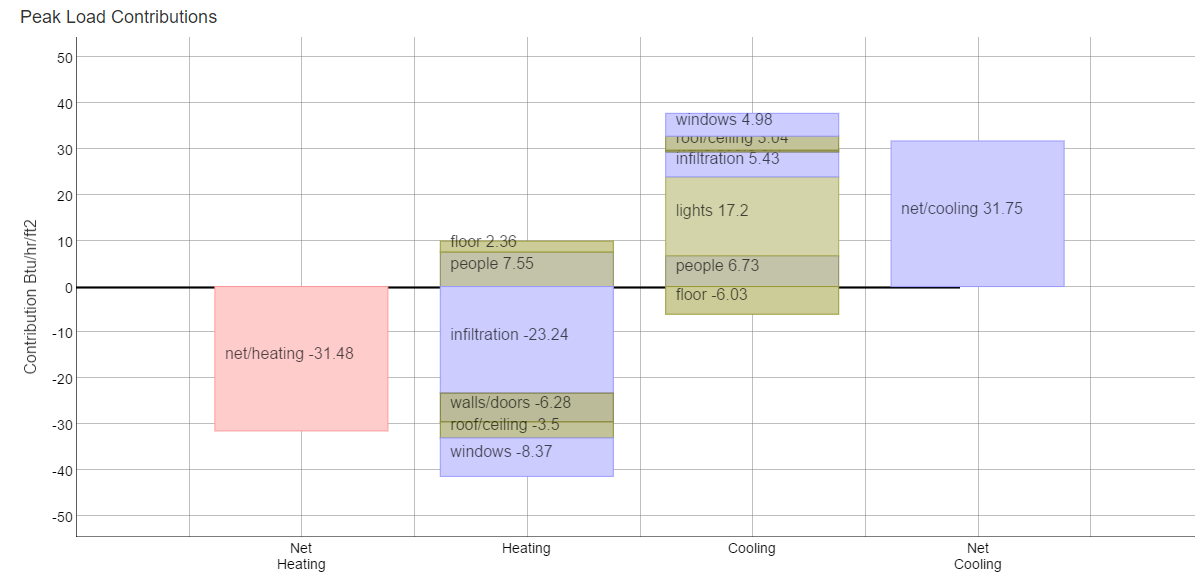
I'm not sure when this changed (@JasonGlazer would know). But if you open the measure file and change all instances of "ZoneComponentLoadSummary" (lines 395, 422, 494, 498, 639 and 660), the peak load contributions charts will work:

You'll still see some warnings in the stdout, but some of them can be ignored (either the queried values aren't used in the report, or don't exist in that model). I didn't check every one though, so there still might be some malformed queries that should be fixed.
FYI @David Goldwasser
 | 2 | No.2 Revision |
The major thing that seems to have changes is the "Zone Component Load Summary" report name now includes spaces, where the measure uses "ZoneComponentLoadSummary" in the queries of the sql file.
I'm not sure when this changed (@JasonGlazer ( @JasonGlazer would know). But if you open the measure file and change all instances of "ZoneComponentLoadSummary" (lines 395, 422, 494, 498, 639 and 660), 660) to "Zone Component Load Summary", the peak load contributions charts will work:

You'll still see some warnings in the stdout, but some of them can be ignored (either the queried values aren't used in the report, or don't exist in that model). I didn't check every one though, so there still might be some malformed queries that should be fixed.
FYI @David Goldwasser Goldwasser
 | 3 | No.3 Revision |
The major thing that seems to have changes changed is the "Zone Component Load Summary" report name now includes spaces, where the measure uses "ZoneComponentLoadSummary" in the queries of the sql file.
I'm not sure when this changed ( @JasonGlazer would know). But if you open the measure file and change all instances of "ZoneComponentLoadSummary" (lines 395, 422, 494, 498, 639 and 660) to "Zone Component Load Summary", the peak load contributions charts will work:

You'll still see some warnings in the stdout, but some of them can be ignored (either the queried values aren't used in the report, or don't exist in that model). I didn't check every one though, so there still might be some malformed queries that should be fixed.
FYI @David Goldwasser
