Question-and-Answer Resource for the Building Energy Modeling Community
First time here? Check out the Help page!
| | 1 | initial version |
Your Independent variables are definitely wrong. You seem to have entered temperatures in Farenheit, you need to use Celsius.
Looking at your spreadsheet, the output values of the curve above does not match what was in the table.
Your Independent Variable list (OS:ModelObjectList) has a wrong handle with respect to your first Table Independent Variable (one ends with 12 the other with 11)
OS:ModelObjectList,
   {35c0814c-9d56-4515-b377-2fd91c445712}, !- Model Object 1

OS:Table:IndependentVariable,
  {35c0814c-9d56-4515-b377-2fd91c445711}, !- Handle
Here is a python script you can use to format your Table to a csv
import openstudio
from itertools import product
import pandas as pd

m = openstudio.model.Model.load('model.osm').get()
table = m.getTableLookups()[0]

xs = list(product(*[i.values() for i in table.independentVariables()]))
ys = table.outputValues()

assert len(xs) == len(ys), f"Product of independant variables is size {len(xs)} when dependent variable has {len(ys)} elements"
df = pd.DataFrame(xs, columns=["Indoor T WB (C)", "Condenser Entering T DB (C)"])
df["Cooling Capacity"] = ys
df.to_csv('table.csv')
If you don't have python installed, you can use the OpenStudio CLI to run it. Place it next to your model.osm, save it as curve.py and call openstudio curve.py. You'll have a table.csv as a result
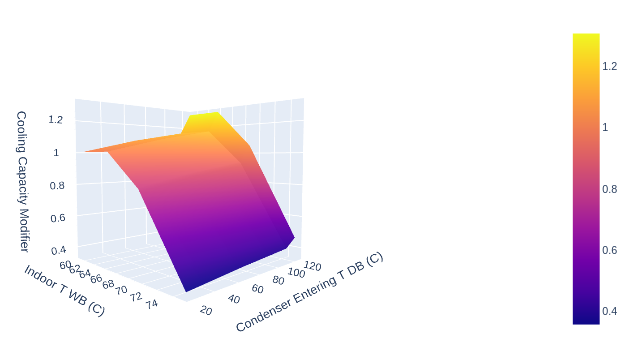
Currently your curve looks like this: