VRF Performance Curve, os:table input


Hi. I am trying to build the cooling performance curve for VRF condensing unit. Following specific excel template which is this (https://docs.google.com/spreadsheets/...).
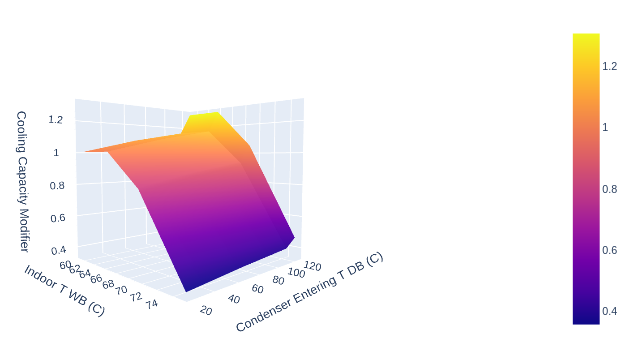
Based on my input, I got ended up having this curve (table) for the temperature-capacity curve.
OS:Table:Lookup,
  {5532089b-8c9b-4aff-9371-984933646b1a}, !- Handle
  Table Lookup EP120TNU/YNU CLG_CCR_fn_T-Output,!- Name
  {98862933-0764-43a3-aa10-ad8a7a159775}, !- Independent Variable List Name
  DivisorOnly,                            !- Normalization Method
  1,                                      !- Normalization Divisor
  0.35703950257726, !- Minimum Output {BasedOnField A5}
  1.30663523102881, !- Maximum Output {BasedOnField A5}
  Dimensionless,                          !- Output Unit Type
  ,                                       !- External File Name
  ,                                       !- External File Column Number
  ,                                       !- External File Starting Row Number
  1.00288776398616,!- Output Value 1 {BasedOnField A5}
  1.00418987741641,!- Output Value 2 {BasedOnField A5}
  0.808872862877439,!- Output Value 3 {BasedOnField A5}
  0.35703950257726,!- Output Value 4 {BasedOnField A5}
  1.08774749786191,!- Output Value 5 {BasedOnField A5}
  1.08915979012088,!- Output Value 6 {BasedOnField A5}
  0.87731595127476,!- Output Value 7 {BasedOnField A5}
  0.38725053741072,!- Output Value 8 {BasedOnField A5}
  1.15599133978996,!- Output Value 9 {BasedOnField A5}
  1.15749223740069,!- Output Value 10 {BasedOnField A5}
  0.93235759579009,!- Output Value 11 {BasedOnField A5}
  0.411546124864202,!- Output Value 12 {BasedOnField A5}
  1.30494094260684,!- Output Value 13 {BasedOnField A5}
  1.30663523102881,!- Output Value 14 {BasedOnField A5}
  1.05249196773224,!- Output Value 15 {BasedOnField A5}
  0.46457388530615;!- Output Value 16 {BasedOnField A5}

OS:ModelObjectList,
  {98862933-0764-43a3-aa10-ad8a7a159775}, !- Handle
   Table Lookup EP120TNU/YNU CLG_CCR_fn_T-Output_List, !- Name
  {35c0814c-9d56-4515-b377-2fd91c445712}, !- Model Object 1
  {7bf540c0-cc77-4615-9b59-9ed9c499cff6}; !- Model Object 2

OS:Table:IndependentVariable,
  {35c0814c-9d56-4515-b377-2fd91c445711}, !- Handle
  Table Lookup EP120TNU/YNU CLG_CCR_fn_T-Input_0,!- Name
  Linear,                                 !- Interpolation Method
  Constant,                               !- Extrapolation Method
  59.0106312292358,!- Minimum Value {BasedOnField A5}
  74.9893687707641,!- Maximum Value {BasedOnField A5}
  ,                                       !- Normalization Reference Value {BasedOnField A5}
  Temperature,                            !- Unit Type
  ,                                       !- External File Name
  ,                                       !- External File Column Number
  ,                                       !- External File Starting Row Number
  59.0106312292358,!- Value 1
  64.0179401993355,!- Value 2
  68.9401993355481,!- Value 3
  74.9893687707641;!- Value 4

OS:Table:IndependentVariable,
  {7bf540c0-cc77-4615-9b59-9ed9c499cff6}, !- Handle
  Table Lookup EP120TNU/YNU CLG_CCR_fn_T-Input_1,!- Name
  Linear,                                 !- Interpolation Method
  Constant,                               !- Extrapolation Method
  22.8771804062126,!- Minimum Value {BasedOnField A5}
  115.053285543608,!- Maximum Value {BasedOnField A5}
  ,                                       !- Normalization Reference Value {BasedOnField A5}
  Temperature,                            !- Unit Type
  ,                                       !- External File Name
  ,                                       !- External File Column Number
  ,                                       !- External File Starting Row Number
  22.8771804062126,!- Value 1
  67.8905615292712,!- Value 2
  115.053285543608,!- Value 3
  125.738590203106;!- Value 4
Within the openstudio, I could not see the inputs within the openstudio interface starting the line with "OS:Table:IndependentVariable," in the middle of script.
For trouble shooting, I would like to confirm this table is really working correctly or no.
Is there any method that I can see these independent variable tables are connected with output curve above?
Thank you.
add a comment